How many active accounts does the Hive blockchain have in 2025? What are they doing on chain, posting, gaming, transferring funds?
The Hive blockchains has around 2.56M. What percentage of these accounts are active?
How has the market influenced the number of active accounts?
Let’s take a look!

Top Four Hive Operations
We will be looking at the activity on the chain by the top operations made:
- Post and comment
- Votes/Curate
- Transfer coins
- Custom JSON transactions
Apart from the above, reading, or page views, is also a crucial part of this ecosystem, but this type of operation is not stored on the blockchain.
We will be looking at the number of active accounts by the operations stated above for the 2020 – 2024 period.
We will be looking at the number of DAUs (daily active users), the number of MAUs (monthly active users), and then summary for the whole year.
Daily Number of Active Accounts
First let’s take a look at the number of accounts active per day. Here is the chart.
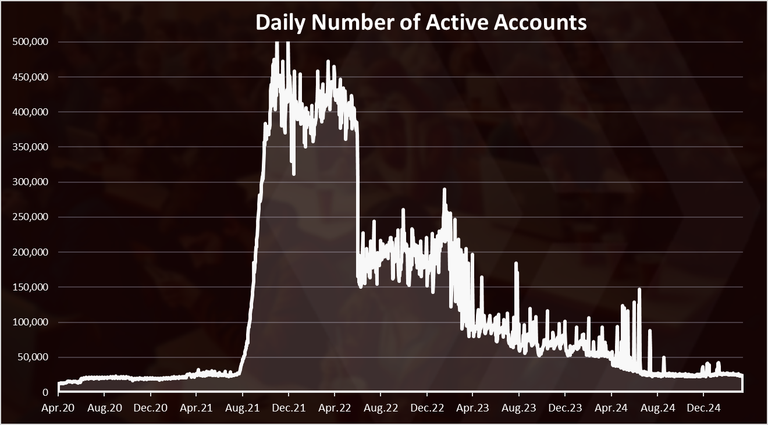
The above is the chart for DAUs, for accounts making any type of operation.
This chart is from the Hive creation fork, back from March 2020. As we can see at first in 2020 the number of DAUs was low with around 15k to 20k accounts making any type of operation on the Hive blockchain daily.
Then in the summer of 2021 this number increased significantly driven by the success of Splinterlands. At one point the DAUS reached 500k per day.
After the craze of 2021 the number of DAUs dropped and we are now at 24K DAUs.
Most of these movements are due to Splinterlands active players.
Active Accounts by Category
What type of operations are these accounts making?
From previous analysis we know that most of the DAUs are coming from Splinterlands. If we take a look at a chart with active accounts per operation, we got this:
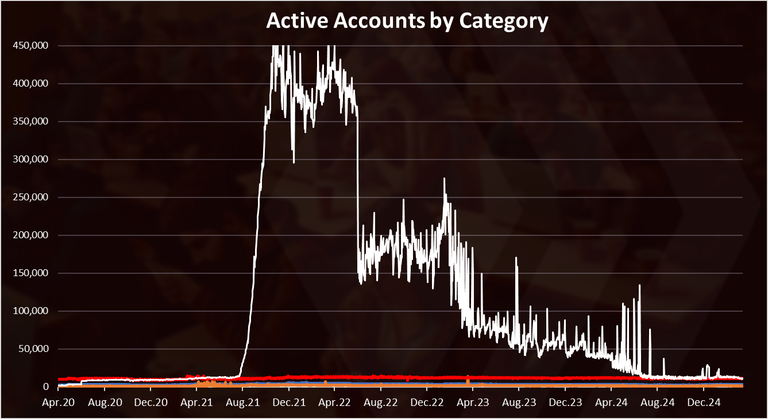
The top line are the accounts making custom JSON operations, that in most cases are gaming/Splinterlands operations. The number of these accounts have been much higher then the rest of the operations that we can barely see them on the bottom of the chart. Although we can notice that they have declined significantly.
If we zoom in 2024-2025 we get this:
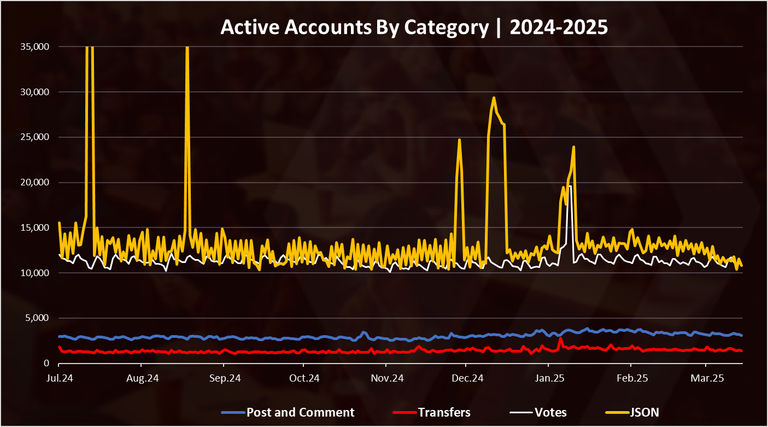
This is a period where we have more stable numbers. We can see that the custom JSON accounts are now close to the voting/curating accounts both with around 13k daily. The number of accounts posting daily is around 3.3k and accounts making transfers around 1.6k.
Active Accounts Posting or Commenting
If we focus only on the core activity so to speak, the chart for accounts making post or comments looks like this:
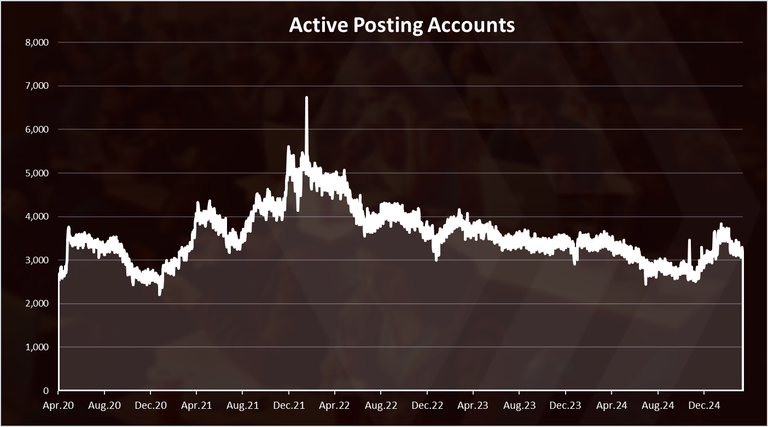
We can notice the uptrend until January 2022, and then a steady downtrend since then.
In the recent period we can see a small growth in the number of posting accounts, from bellow 3k up to3.3k DAUs where we are now.
Monthly Number of Active Accounts
The monthly numbers might give a better perspective for active accounts, as not all the users are making operations daily. Here is the chart.
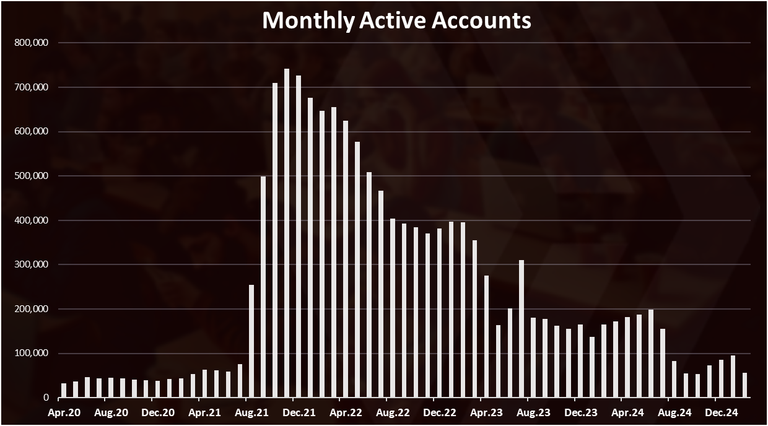
We can see the sharp increase in the MAUs back in 2021. From around 50k to more than 700k in a few months. After the peak at the end of 2021, the number of MAUs has steadily been going down.
The lows were in the summer of 2024, then a growth toward the end of the year.
Again these strong oscillations are driven from the Splinterlands activity.
When we zoom in 2024-2025 for MAUs we get this:
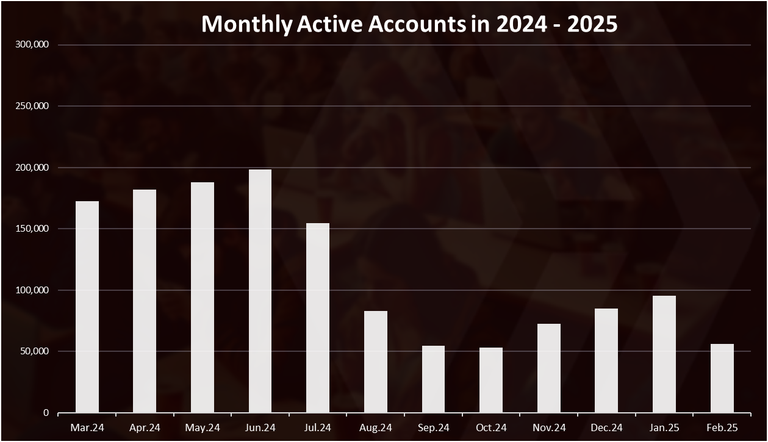
More stable data here.
We can notice that back in the spring of 2024 the numbers were close to 200k, then a drop in the summer of 2024 and in September we were close to 50k. Towards the end of the year we have seen a growth up to 100k MAUs, double than the previous lows. February 2025 has seen a drop again.
The recent movement are more price driven.
Around 400k MAUs at the beginning of 2023, while we are now at 55k. All these wild oscillations are mostly due to Splinterlands. The 50k MAUs seems where we were in 2020, so it might be the bottom.
When we breakdown the monthly active accounts by type of operation we get this:
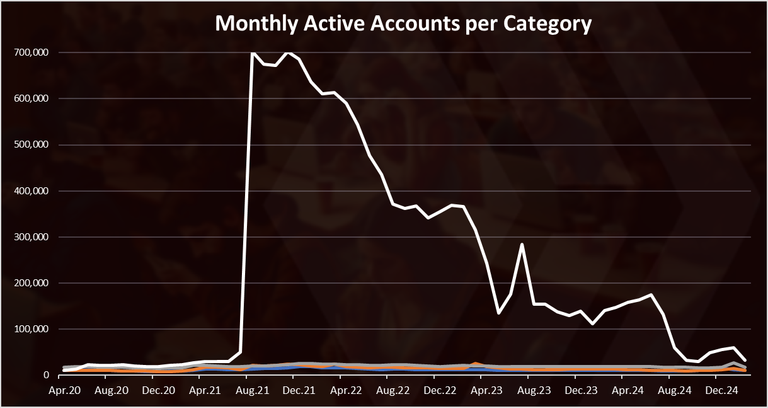
As for the DAUs, we can see that the custom JSON operations dominate this chart as well.
Back in 2021 there were 700k accounts making custom json operations while now we are in the range of 50k to 100k.
Active Hive Accounts by Category
For the last 30 days, the number of MAUs, summarized by categories looks like this.
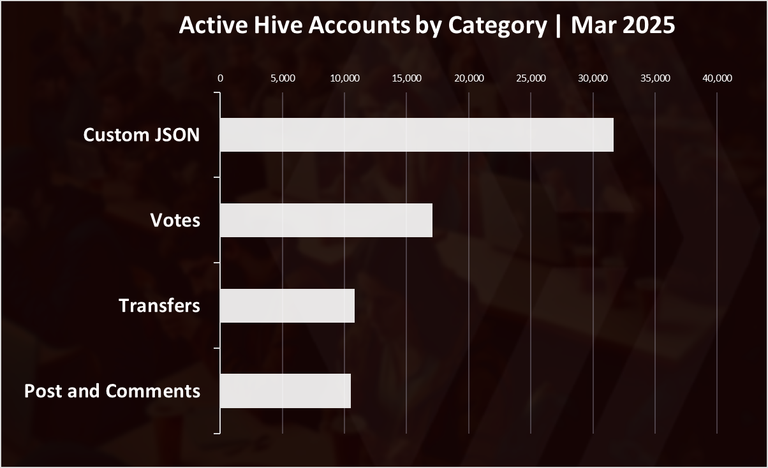
Number of active accounts in October 2024 by operation:
- Custom JSON - 31k
- Votes – 17k
- Transfers – 10.8k
- Post and Comments – 10.5k
Gaming is on the top, in the second spot with 16k is curation/votes, then comes transfers and posting comes at the end.
All the best
@dalz
Wow. I was not aware of the extent to which Splinterlands dropped off, which seems to be the main driver in those charts.
Yea, you can see it clearly in the breakdown ... the custom JSON tx
Considering the whole world, the number of the daily active users for all categorise is not high for a 9 years old platform, in my opinion.
Its far from mass adoption ... that for sure :)
Do you think why?
I guess the drop in daily and monthly active account must have been somehow related to the price of hive itself. It seems people tend to be more active when the price is high which makes sense because authors get higher curation rewards. I hope hive does well this year so there will be more activity on the platform. Thanks for the stats.
Yes, price drives activity a lot
Exactly - my intro post made $13k - that got people looking. Days long gone
Wow. 13k is a lot. Thanks for sticking around on the platform.
This is a big drop in the users count in a period of 2 years. Does it mean people left playing splinterlands and because of that they left hive too?
To certain degree .... but it was mostly driven by bot accounts that are now not active
So its good for us because even if we have less users but most of them are humans however we require more users for hive to grow.
In 2021, GameFi dominates and SPLINTERLANDS, one of them, can increase the value of HIVE. Unfortunately in this year (2025) the popularity of GameFi tends to decline and is replaced by other narratives (Memecoins, AI Agent, RWA). Even though HIVE also has SocialFi (or Decentralized Social Media?), unfortunately, this narrative is not as good as the 3 narratives I mentioned earlier.
2025 is still three months old. Hopefully, something will increase the popularity of SocialFi or HIVE itself in the next month, increasing HIVE's value and maybe creating a new ATH this year.
Can safely say they are not reading @actifit posts - been writing these since the start and seldom see more than 150 eyeballs
!PIZZA
$PIZZA slices delivered:
@danzocal(2/10) tipped @dalz
It's fascinating to see the detailed breakdown of Hive's active accounts and the influence of Splinterlands on these numbers over the years. The fluctuation in daily and monthly active users clearly reflects the market dynamics and trends within the ecosystem. Despite the decline from previous peaks, the stability in certain activities like voting and posting is encouraging. Thank you for providing such insightful statistics and analysis!