Hive is known for free transactions!
With the last Hardfork in October 2022, RCs were separated from HP, and this enabled even better management of the resource credits system and the feeless transactions.
In the past years games and especially Splinterlands have taken advantage of this and increased their product and users.
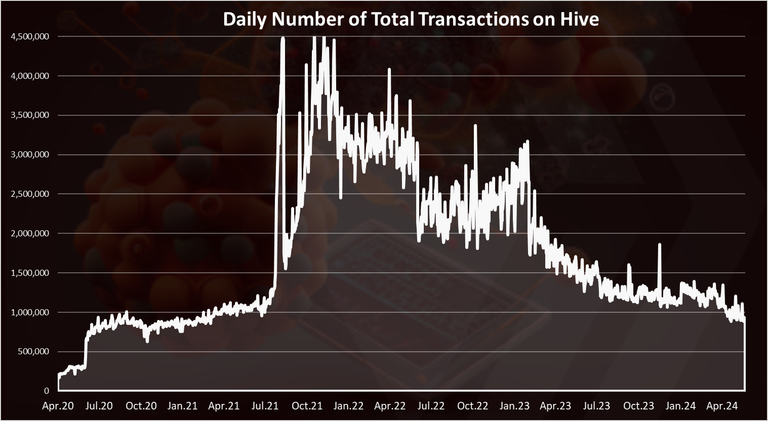
How are we doing these days in terms of transactions?
Usually when talking about activity on the Hive blockchain a lot of the users have in mind posting and commenting. Here we will be looking in the top activities on the blockchain:
- Posts and Comments
- Votes
- Transfers
- Custom JSON operations
The above consists of the majority of all the transactions on the blockchain.
Number of Posts and Comments
Although gaming is growing on the blockchain, blogging still remains the core activity and one of the key method inflations is distributed. Users can blog about gaming as well 😊.
Here is the chart for the number of posts and comments on the Hive blockchain.
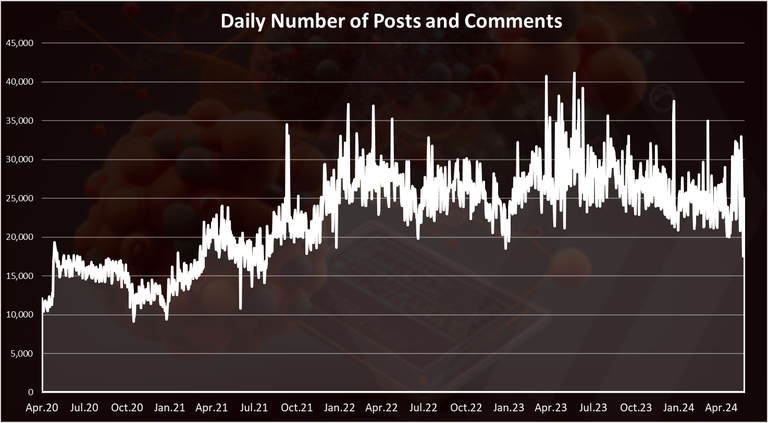
Starting from 2020 till today, we can see an overall uptrend in the number of posts and comments, when we look at them together. There was a peak back in April 2023, and a small decline at the end of 2023. It’s quite different from the overall price action.
In the last period the numbers are quite constant in the range of 25k to 30k per day.
Note that this increase is mostly driven by the Leothreads, where there are a lot of comments now.
When we break down the activity in posts and comments we get this:
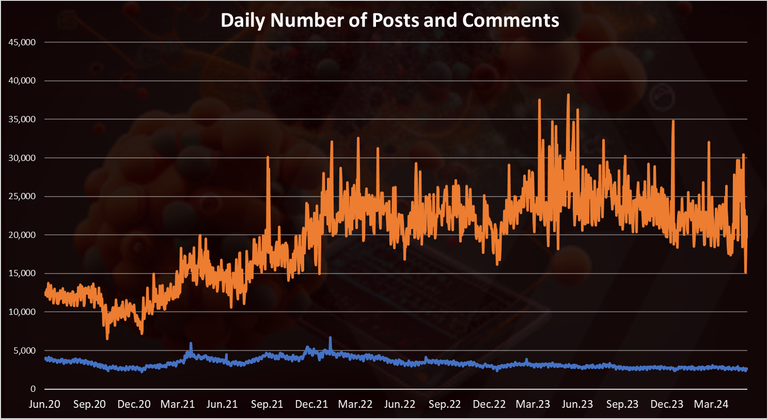
Here we can notice that the number of comments has increased while the number of posts has slightly decreased in the period.
At the beginning of 2023 on average there were around 3100 posts and 22k comments daily. In the last months there are 2600 posts daily and again around 22k comments. The number of comments has been going up and down in 2023, with a peak in June 2023, when on occasions there were 35k comments daily, then a drop ending the year the same as when it started.
Number of Votes
The chart for the votes looks like this.
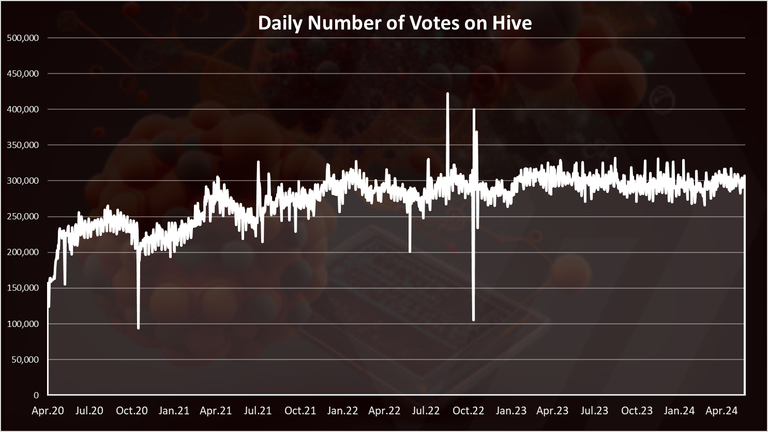
Votes are one of the core operations on the Hive blockchain. That is how the rewards are distributed. The Proof of Brain mechanism (PoB).
The number of votes has been quite steady in the period, compared to the price volatility.
Votes have been almost constant around the 300k per day now.
Number of Transfers
The chart for the transactions looks like this.
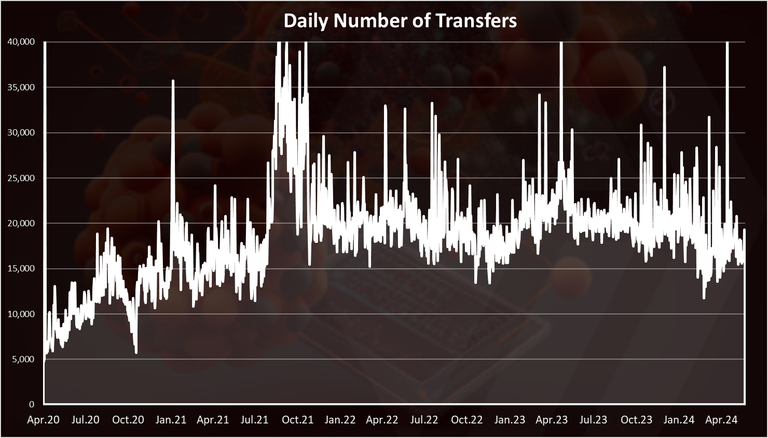
There has been an uptrend in the period 2020 to 2022, while in 2023 there has been some oscillations and peaks, but overall, the year is quite constant in terms of token transfers. On average around 18k transfers per day.
Number of Custom JSONs operations
The chart for custom JSONs operations.
This is the number one type of operation on the blockchain at the moment.
This is the most volatile chart of all the types of operations on Hive. It mostly follows the Splinterlands development and activities. The ATH for custom jsons was back in the end of 2021, when on occasions there was 5M transactions per day.
In 2023 the number of custom jsons operations has dropped from around 2M per day at the beginning of the year to around 1M at the end of the year. A further drop in 2024 to around 500k transactions per day.
Monthly Number of Transactions per Category
The monthly chart presents a better overview of the transactions. Here it is.
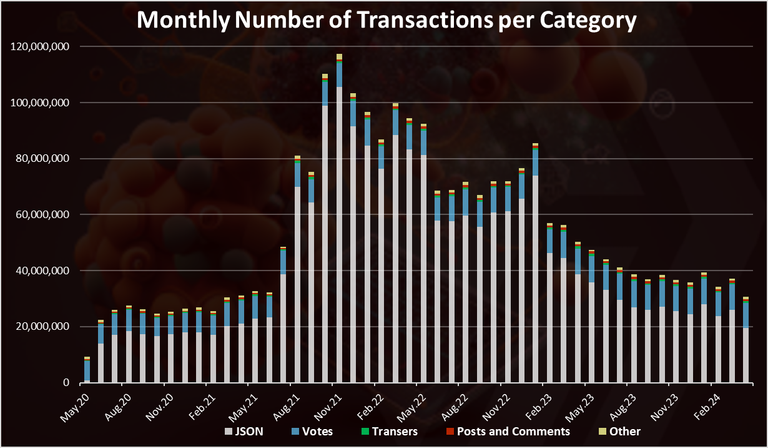
We can see that the custom json operations are dominating the chart and are defining the trend.
The ATH was back in November 2021, with more than 100M operations.
When we zoom in 2023-2024 we get this:
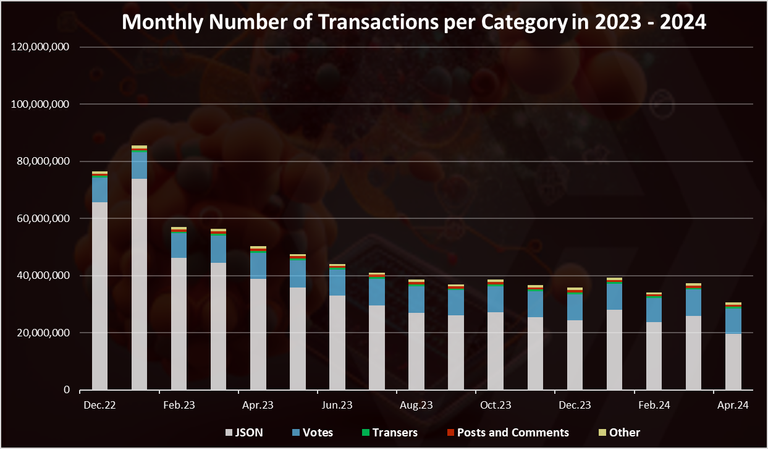
At the begging of the 2023 there were around 80M transactions per month, while the year ended with just bellow 40M transactions. In 2024 there is around 25M transactions per month.
Again, this is because of the drop in the Splinterlands activities. Although it seems that the numbers have stabilized since the summer of 2023 and have been quite constant in the second half of 2023.
Top Operations in 2024
Here is the chart for the transactions per category from the begging of 2024 till now.
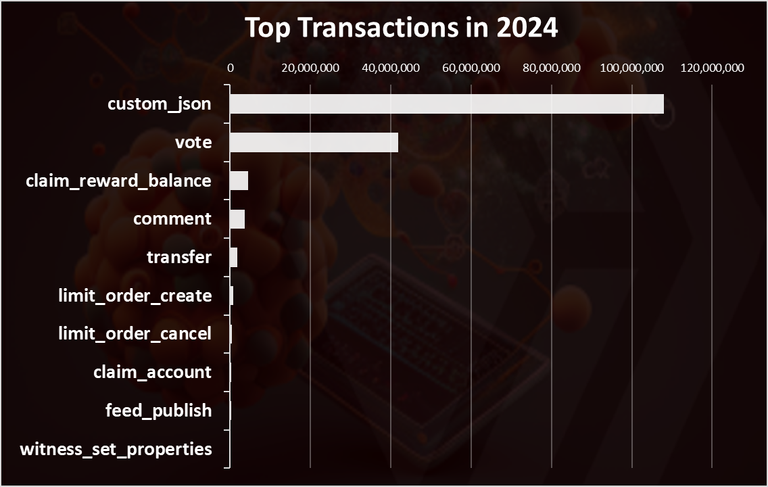
Not surprising, the custom jsons comes on the top with more than 100M transactions in 2024. Next are votes with 42M, and interestingly enough the claim reward button on the third place with 4.6M. The comment operation that stands for posts and comments is in the fourth place.
There is a big drop in the numbers after the vote operations. Unlike the previous years when the custom jsons were absolutely dominant on the top, now they are still on top, but not as that far in front of the vote operation.
Another interesting operations from the list above is the limit orders that are made on the internal DEX. This is as a result of more liquid internal DEX and more trading operations made there, basically using the Hive chain as an exchange. Another of the many functionalities.
The pie chart looks like this:
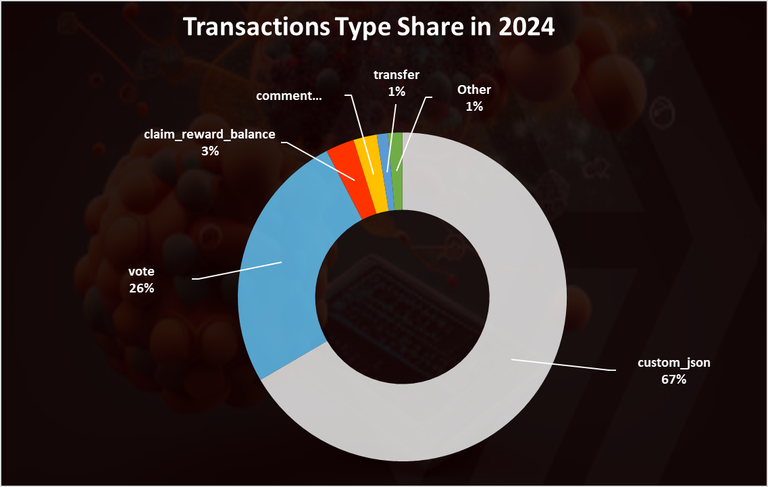
Here once again we can see the custom json transactions are on the top. A 67% of all the transactions on chain in 2024 belong to this category. In 2023 the share was close to 80%.
The vote operation has a 26% share.
Also, we should bear in mind that not all the transactions above have the same weight. Publishing a post usually requires more effort than just clicking an in-game button or clicking the like button.
Overall except for the custom json operations, all the other activity has remained almost stable or with a small drop.
All the best
@dalz
How comes there is a 26% votes while posts/comments are around ~2% of the transactions? ¿What the hell they are voting?
Votes and posts are not the same weight. Posts takes much longer to make, while votes are on click operation, often automated. As in traditional social media, one post usualy have more votes.
The one and only Dalz once again with another awesome report 😍 Personally, I think the growth in transfers shows how active the community is becoming. Looking forward to more insights like this. Keep up the awesome work good friend
!LUV The excellent reporting. !LOLZ
I have been playing around with different activities on Hive to better understand rewards. Which activity is more #FUN and rewarding?
Out of curiosity, when I execute buy and sell orders on Tribaldex, are those activities captured in your reporting?
Yes those are qustom json operations
The transactions that took place in Splinterlands were previously overwhelming. Interest has decreased slightly compared to before. As such, it has caused a decrease in the number of transactions in the hive ecosystem.
While it is sad to see that we are posting lower numbers in the monthly timeframe, it is nice that we are slowly increasing in the daily timeframe. Hopefully this is the start of the reversal.
Wow
It’s good to see that people are getting more active on Hive
I’m glad!
The numbers of posts , comments and transections are decreasing, and others are stable. Great post , huge information
it is a very informative post & and thanks for detailed post.
This is very informative post, we will know the exact numbers of users in hive blockchain, thank you for sharing this important information.
Thank you for sharing the data.😊
These are very interesting information. More transactions on the hive Blockchain is excellent !
Thanks for sharing! - @yonilkar

Splinterlands in the top of activities on the blockchain.
@tipu curate
Upvoted 👌 (Mana: 5/45) Liquid rewards.
!ALIVE
Thank you for giving us this complete detail and Information