Welcome to my Hive Stats Report for Friday, September 18, 2020. All data is collected directly from the Hive blockchain and is based on UTC time.
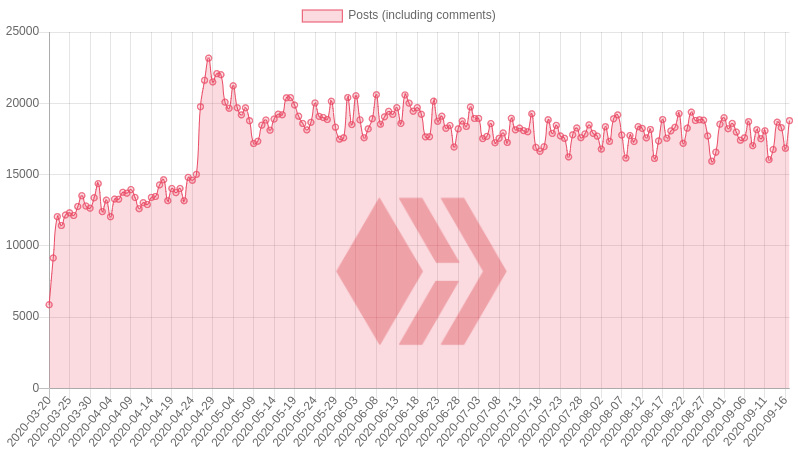
1. Daily number of Posts (including comments)
| Date | Posts |
|---|---|
| 2020-09-17 | 18,782 |
| 2020-09-16 | 16,840 |
| 2020-09-15 | 18,288 |
| 2020-09-14 | 18,674 |
| 2020-09-13 | 16,754 |
| 2020-09-12 | 16,045 |
| 2020-09-11 | 18,067 |
| 2020-09-10 | 17,513 |

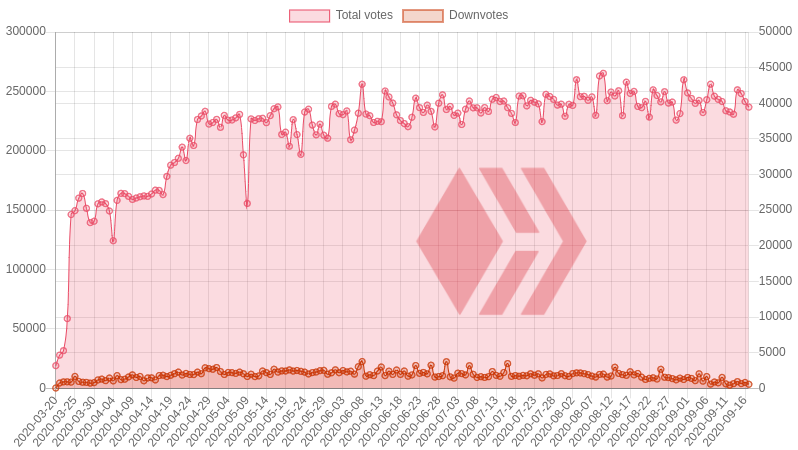
2. Daily number of votes
| Date | Total votes | Downvotes | Percent downvotes |
|---|---|---|---|
| 2020-09-17 | 236,781 | 574 | 0.24% |
| 2020-09-16 | 241,462 | 827 | 0.34% |
| 2020-09-15 | 248,151 | 668 | 0.27% |
| 2020-09-14 | 251,327 | 944 | 0.38% |
| 2020-09-13 | 230,749 | 661 | 0.29% |
| 2020-09-12 | 232,661 | 441 | 0.19% |
| 2020-09-11 | 233,684 | 628 | 0.27% |
| 2020-09-10 | 241,471 | 1,535 | 0.64% |
3. Daily accounts transacting
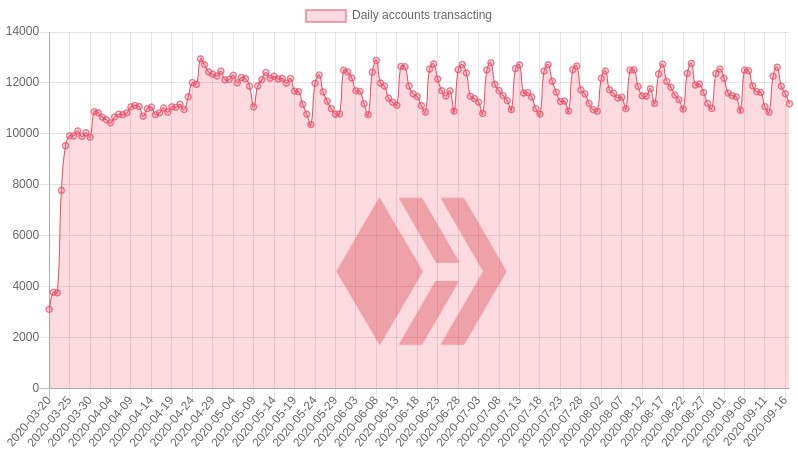
A 'transacting account' is a Hive account that made at least one transaction on the Hive blockchain. This can be a vote, post, comment, transfer, power up or HBD conversion. Users who only read from the Hive blockchain without interacting are not included. The actual number of 'Active users' is therefore much higher than the accounts transacting.
| Date | Accounts transacting |
|---|---|
| 2020-09-17 | 11,183 |
| 2020-09-16 | 11,575 |
| 2020-09-15 | 11,870 |
| 2020-09-14 | 12,617 |
| 2020-09-13 | 12,263 |
| 2020-09-12 | 10,850 |
| 2020-09-11 | 11,070 |
| 2020-09-10 | 11,619 |
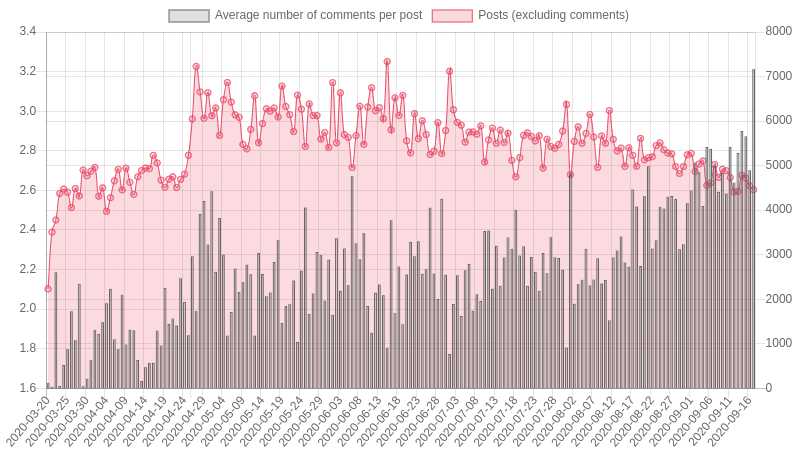
4. Posts + Comments per post
| Date | Average # comments | Posts |
|---|---|---|
| 2020-09-17 | 3.21 | 4,459 |
| 2020-09-16 | 2.70 | 4,549 |
| 2020-09-15 | 2.87 | 4,722 |
| 2020-09-14 | 2.90 | 4,788 |
| 2020-09-13 | 2.79 | 4,422 |
| 2020-09-12 | 2.64 | 4,408 |
| 2020-09-11 | 2.82 | 4,731 |
| 2020-09-10 | 2.58 | 4,886 |
5. New accounts created
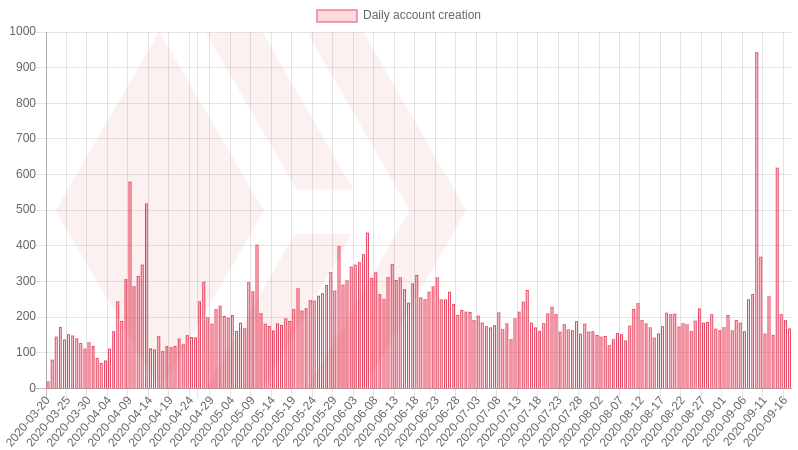
| Date | New Accounts |
|---|---|
| 2020-09-17 | 168 |
| 2020-09-16 | 191 |
| 2020-09-15 | 208 |
| 2020-09-14 | 619 |
| 2020-09-13 | 150 |
| 2020-09-12 | 258 |
| 2020-09-11 | 153 |
| 2020-09-10 | 369 |
Who created the new accounts yesterday
| Account | Accounts created |
|---|---|
| @steemmonsters | 69 |
| @oracle-d | 57 |
| @wallet.creator | 15 |
| @esteemapp | 12 |
| @threespeak | 7 |
6. New communities created
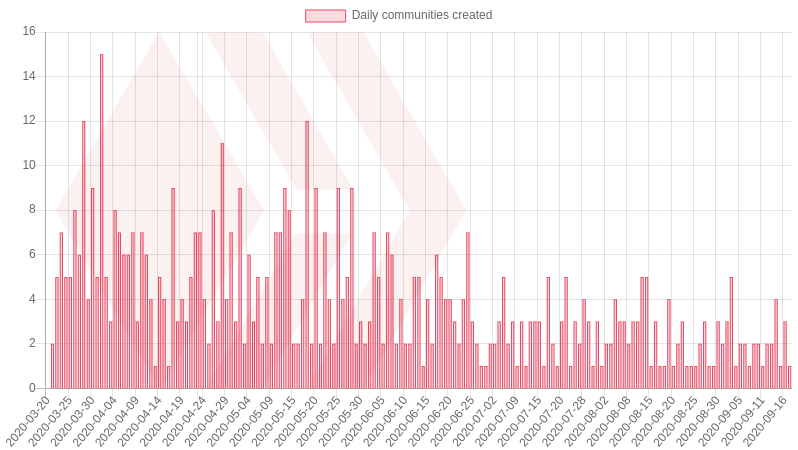
| Date | New Communities |
|---|---|
| 2020-09-17 | 1 |
| 2020-09-16 | 3 |
| 2020-09-15 | 1 |
| 2020-09-14 | 4 |
| 2020-09-13 | 2 |
| 2020-09-12 | 2 |
| 2020-09-11 | 1 |
| 2020-09-09 | 2 |
Newest communities:
@hive-144994
7. Daily Amount of HBD converted to HIVE
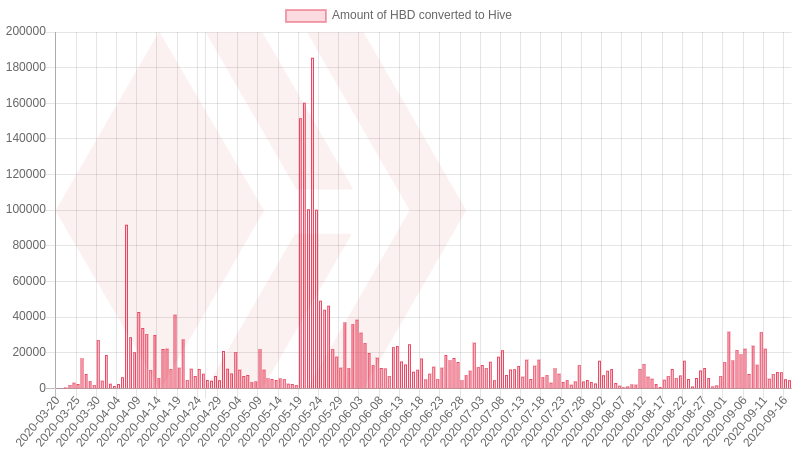
| Date | Amount in HBD |
|---|---|
| 2020-09-17 | 4,590 HBD |
| 2020-09-16 | 5,163 HBD |
| 2020-09-15 | 8,979 HBD |
| 2020-09-14 | 9,145 HBD |
| 2020-09-13 | 7,974 HBD |
| 2020-09-12 | 5,401 HBD |
| 2020-09-11 | 22,265 HBD |
| 2020-09-10 | 31,423 HBD |
8. Daily Amount of HIVE Powered UP & DOWN
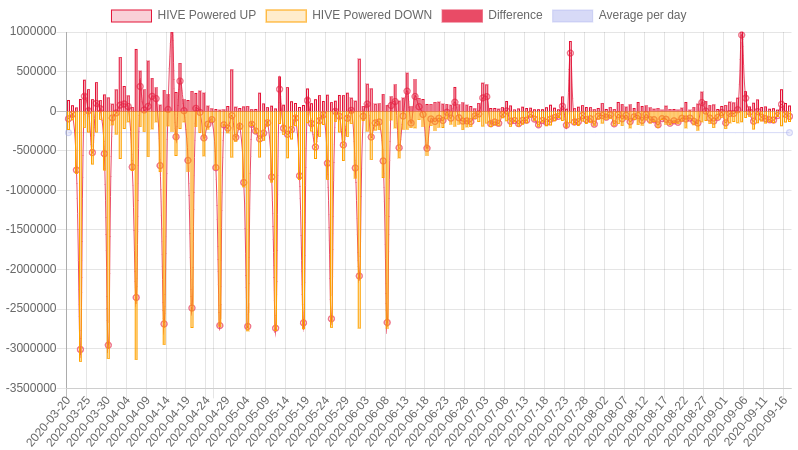
| Date | Powered UP | Powered DOWN | Difference |
|---|---|---|---|
| 2020-09-17 | 71,295 HIVE | 137,089 HIVE | -65,794 HIVE |
| 2020-09-16 | 103,069 HIVE | 141,929 HIVE | -38,860 HIVE |
| 2020-09-15 | 277,542 HIVE | 190,481 HIVE | 87,061 HIVE |
| 2020-09-14 | 17,832 HIVE | 72,848 HIVE | -55,016 HIVE |
| 2020-09-13 | 36,934 HIVE | 149,320 HIVE | -112,386 HIVE |
| 2020-09-12 | 29,290 HIVE | 137,542 HIVE | -108,252 HIVE |
| 2020-09-11 | 60,011 HIVE | 154,819 HIVE | -94,808 HIVE |
| 2020-09-10 | 53,174 HIVE | 129,790 HIVE | -76,616 HIVE |
| Average p/d | 158,096 HIVE | 428,647 HIVE | -270,551 HIVE |
Largest 'Power ups' yesterday
| Date & Time | From | To | HIVE |
|---|---|---|---|
| Sep 17, 17:52 | @fedesox | @fedesox | 23,220.838 |
| Sep 17, 16:52 | @intacto | @intacto | 9,681.548 |
| Sep 17, 18:38 | @gungunkrishu | @gungunkrishu | 6,000.000 |
| Sep 17, 20:28 | @walterjay | @walterjay | 2,566.000 |
| Sep 17, 00:39 | @generikat | @generikat | 2,490.633 |
| Sep 17, 09:58 | @crazy-andy | @crazy-andy | 2,447.442 |
| Sep 17, 13:09 | @jmtv50 | @jmtv50 | 2,350.000 |
| Sep 17, 07:08 | @jacobtothe | @jacobtothe | 2,000.000 |
| Sep 17, 07:23 | @johannpiber | @johannpiber | 2,000.000 |
| Sep 17, 04:32 | @johannpiber | @johannpiber | 1,500.000 |
9. Daily HIVE transfers
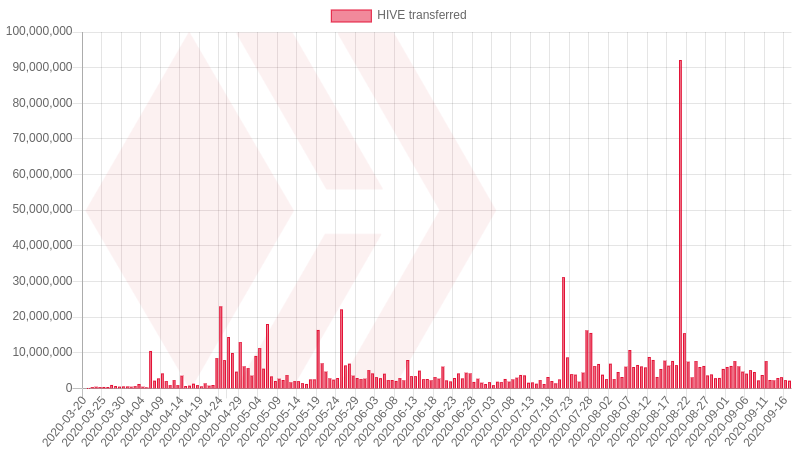
| Date | HIVE transferred |
|---|---|
| 2020-09-17 | 2,161,197 HIVE |
| 2020-09-16 | 2,304,874 HIVE |
| 2020-09-15 | 3,100,981 HIVE |
| 2020-09-14 | 2,906,246 HIVE |
| 2020-09-13 | 2,222,101 HIVE |
| 2020-09-12 | 2,313,493 HIVE |
| 2020-09-11 | 7,617,076 HIVE |
| 2020-09-10 | 3,750,329 HIVE |
10. Daily HIVE Transfers from and to exchanges
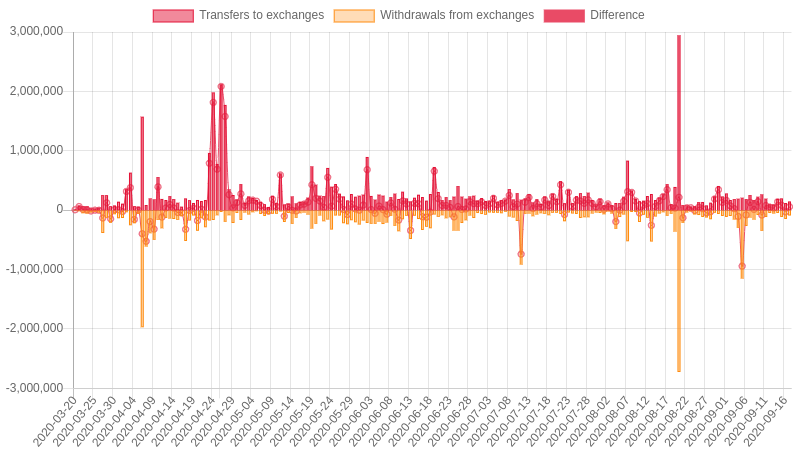
Transfers from one exchange to another are excluded.
| Date | Transfers to exchanges | Withdrawals from exchanges | Difference |
|---|---|---|---|
| 2020-09-17 | 145,339 HIVE | 88,795 HIVE | 56,544 HIVE |
| 2020-09-16 | 119,442 HIVE | 148,319 HIVE | -28,877 HIVE |
| 2020-09-15 | 197,733 HIVE | 115,101 HIVE | 82,632 HIVE |
| 2020-09-14 | 186,131 HIVE | 45,680 HIVE | 140,451 HIVE |
| 2020-09-13 | 94,037 HIVE | 57,786 HIVE | 36,251 HIVE |
| 2020-09-12 | 97,515 HIVE | 45,843 HIVE | 51,672 HIVE |
| 2020-09-11 | 193,553 HIVE | 115,628 HIVE | 77,925 HIVE |
| 2020-09-10 | 265,452 HIVE | 347,240 HIVE | -81,788 HIVE |
Deposits and withdrawals by exchange yesterday
| Exchange | Deposits | Withdrawals | Difference |
|---|---|---|---|
| Binance | 505,344 HIVE | 231,760 HIVE | 273,584 HIVE |
| Bittrex | 39,757 HIVE | 9,569 HIVE | 30,188 HIVE |
| Huobi | 41,245 HIVE | 213,625 HIVE | -172,380 HIVE |
| Upbit | 36,081 HIVE | 161,085 HIVE | -125,004 HIVE |
| Bithumb | 133,650 HIVE | 93,694 HIVE | 39,956 HIVE |
| Probit | 249 HIVE | 649 HIVE | -400 HIVE |
| Ionomy | 1,258 HIVE | 2,575 HIVE | -1,317 HIVE |
| MXC | 0 HIVE | 0 HIVE | 0 HIVE |
| GateIO | 71,199 HIVE | 59,282 HIVE | 11,917 HIVE |
Largest transfers yesterday
| Date & Time | From | To | Amount |
|---|---|---|---|
| Sep 17, 03:56 | @user.dunamu | @hot.dunamu | 203,229.216 HIVE |
| Sep 17, 04:00 | @deepcrypto8 | @binance-hot | 101,689.946 HIVE |
| Sep 17, 16:11 | @binance-hot | @bithumbrecv2 | 93,193.059 HIVE |
| Sep 17, 16:11 | @bithumbrecv2 | @bt20hivedkdnel | 93,193.059 HIVE |
| Sep 17, 03:58 | @bithumbsend2 | @deepcrypto8 | 61,807.280 HIVE |
| Sep 17, 03:50 | @deepcrypto8 | @binance-hot | 51,569.007 HIVE |
| Sep 17, 09:40 | @deepcrypto8 | @binance-hot | 35,771.755 HIVE |
| Sep 17, 03:46 | @hot.dunamu | @deepcrypto8 | 34,827.128 HIVE |
| Sep 17, 09:33 | @bithumbsend2 | @deepcrypto8 | 30,000.000 HIVE |
| Sep 17, 03:55 | @hot.dunamu | @deepcrypto8 | 29,483.666 HIVE |
11. HIVE & HBD details
| Hive | Amount |
|---|---|
| HIVE supply | 369,484,216 HIVE |
| HBD supply | 4,651,914 HBD |
| HIVE virtual supply | 396,848,418 HIVE |
| Vested HIVE / HIVE Power | 138,099,199 HP |
| Non-Vested HIVE | 231,385,017 HIVE |
| HIVE price | $0.172 |
| HIVE base feed price | $0.17 |
¯\___(ツ)____/¯ Follow me @penguinpablo for daily Hive statistics.
I see you've added supply data in recent reports. Will you turn them into graphs in the future?
Unfortunately, I don't have the historic supply data to draw a chart.