Welcome to my Hive vs Steem Stats Report for Saturday, January 23, 2021. All data is collected directly from the Steem and Hive blockchains and is based on UTC time.
1. Posts, including comments
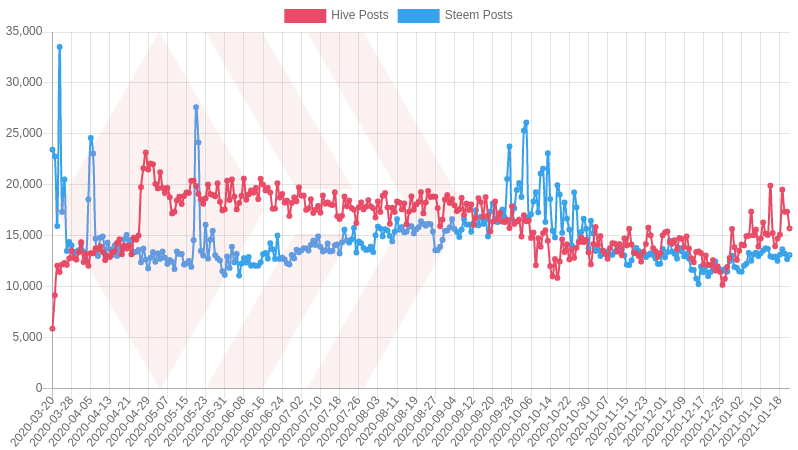
| Date | Hive Posts | Steem Posts |
|---|---|---|
| 2021-01-22 | 15,716 | 13,095 |
| 2021-01-21 | 17,345 | 12,691 |
| 2021-01-20 | 17,342 | 13,247 |
| 2021-01-19 | 19,516 | 13,661 |
| 2021-01-18 | 15,096 | 13,122 |
| 2021-01-17 | 14,715 | 12,521 |
| 2021-01-16 | 13,951 | 12,936 |
| 2021-01-15 | 15,254 | 12,874 |

2. Posts, excluding comments
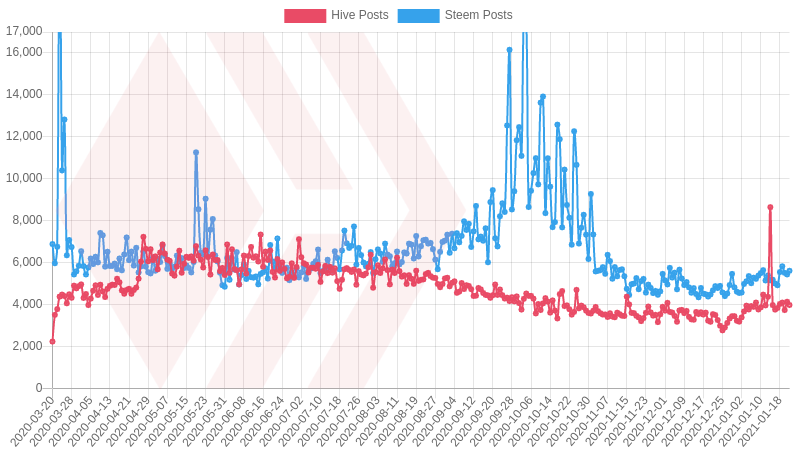
| Date | Hive Posts | Steem Posts |
|---|---|---|
| 2021-01-22 | 3,977 | 5,608 |
| 2021-01-21 | 4,132 | 5,433 |
| 2021-01-20 | 3,735 | 5,510 |
| 2021-01-19 | 4,092 | 5,823 |
| 2021-01-18 | 4,026 | 5,548 |
| 2021-01-17 | 3,835 | 4,920 |
| 2021-01-16 | 3,756 | 5,001 |
| 2021-01-15 | 3,972 | 5,183 |
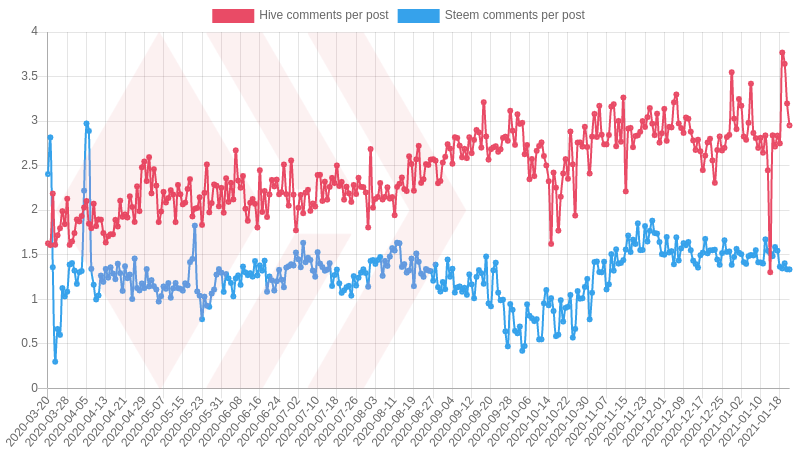
3. Average number of comments per post
4. Daily number of votes
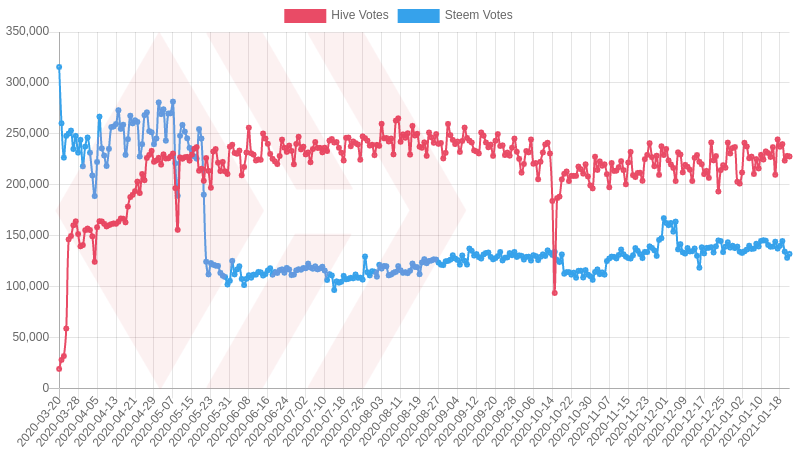
| Date | Hive Votes | Steem Votes |
|---|---|---|
| 2021-01-22 | 227,757 | 132,050 |
| 2021-01-21 | 228,320 | 128,182 |
| 2021-01-20 | 223,693 | 134,290 |
| 2021-01-19 | 239,887 | 144,689 |
| 2021-01-18 | 237,282 | 140,011 |
| 2021-01-17 | 244,495 | 137,293 |
| 2021-01-16 | 209,766 | 144,052 |
| 2021-01-15 | 236,906 | 139,291 |
5. Daily accounts transacting
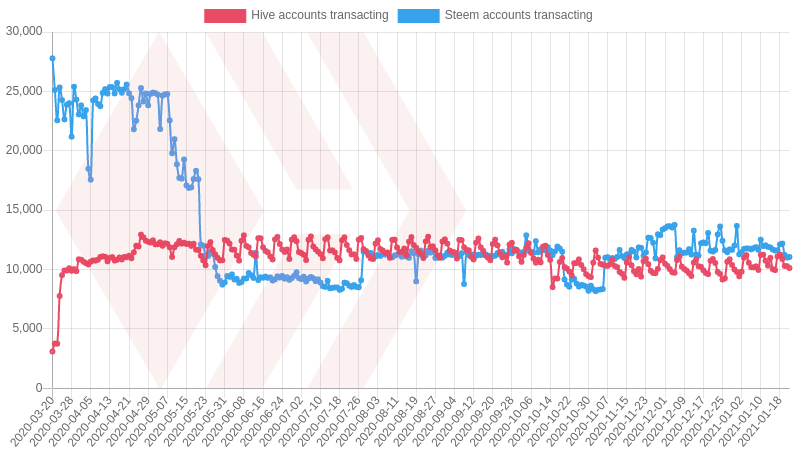
| Date | Hive accounts transacting | Steem accounts transacting |
|---|---|---|
| 2021-01-22 | 10,130 | 11,062 |
| 2021-01-21 | 10,288 | 11,006 |
| 2021-01-20 | 10,303 | 11,231 |
| 2021-01-19 | 10,891 | 12,189 |
| 2021-01-18 | 11,269 | 12,117 |
| 2021-01-17 | 11,115 | 11,631 |
| 2021-01-16 | 9,954 | 11,601 |
| 2021-01-15 | 10,041 | 11,694 |
6. Daily number of users that are posting
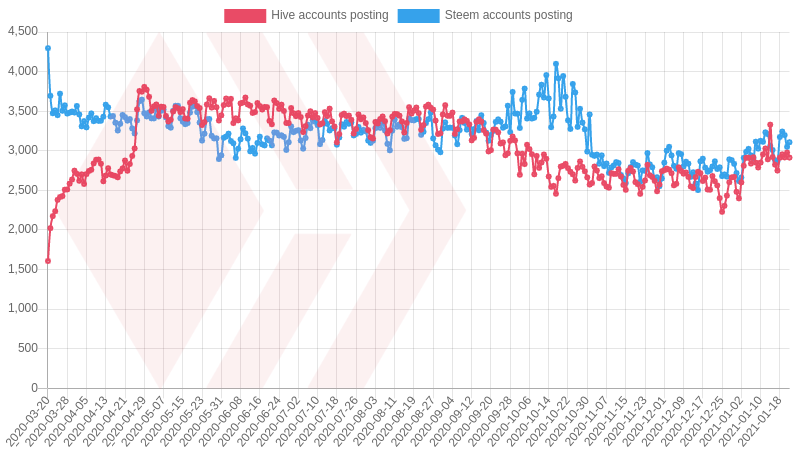
| Date | Hive accounts posting | Steem accounts posting |
|---|---|---|
| 2021-01-22 | 2,914 | 3,108 |
| 2021-01-21 | 2,977 | 3,049 |
| 2021-01-20 | 2,916 | 3,198 |
| 2021-01-19 | 2,955 | 3,243 |
| 2021-01-18 | 2,912 | 3,174 |
| 2021-01-17 | 2,750 | 2,867 |
| 2021-01-16 | 2,825 | 2,882 |
| 2021-01-15 | 2,921 | 3,010 |
7. New accounts created
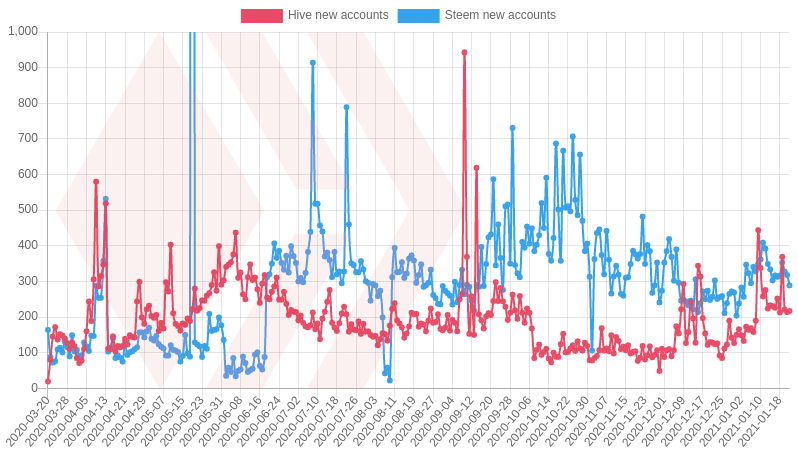
| Date | Hive new accounts | Steem new accounts |
|---|---|---|
| 2021-01-22 | 217 | 289 |
| 2021-01-21 | 214 | 318 |
| 2021-01-20 | 221 | 328 |
| 2021-01-19 | 369 | 353 |
| 2021-01-18 | 213 | 316 |
| 2021-01-17 | 252 | 313 |
| 2021-01-16 | 226 | 317 |
| 2021-01-15 | 231 | 303 |
8. Vesting / Power UP
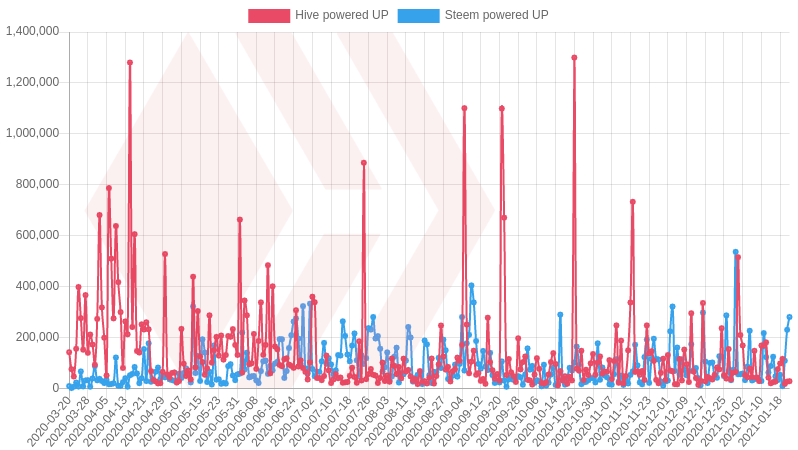
| Date | Hive powered UP | Steem powered UP |
|---|---|---|
| 2021-01-22 | 28,132 | 280,312 |
| 2021-01-21 | 26,473 | 229,997 |
| 2021-01-20 | 17,339 | 108,534 |
| 2021-01-19 | 115,752 | 8,887 |
| 2021-01-18 | 97,609 | 53,325 |
| 2021-01-17 | 75,491 | 32,399 |
| 2021-01-16 | 26,415 | 47,065 |
| 2021-01-15 | 24,652 | 124,149 |
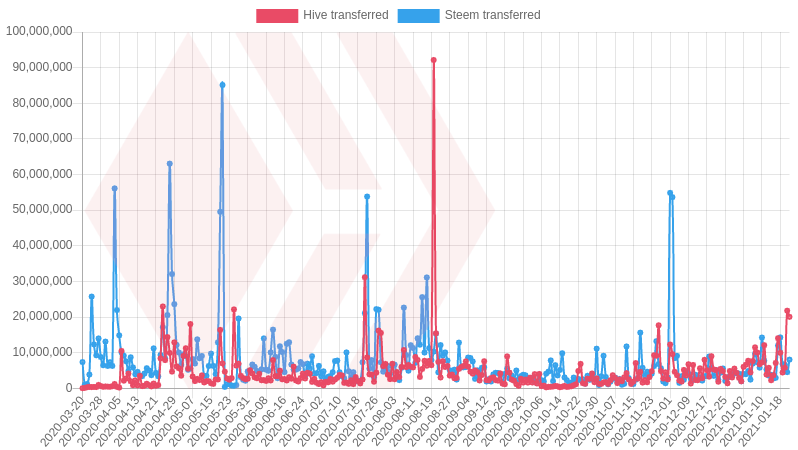
9. HIVE & STEEM transferred
10. HIVE & STEEM Transfers to and from exchanges
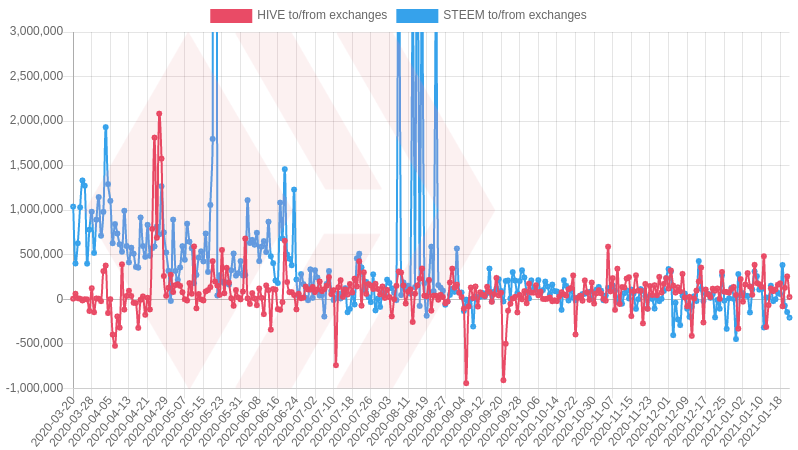
This chart shows the difference between deposits and withdrawals on all exchanges. Transfers from one exchange to another are excluded. A negative number means more withdrawn than deposited.
¯\___(ツ)____/¯ Follow me @penguinpablo for daily Hive statistics.
Lets be honest steem is trash after all the drama a few people over there are now using it as a massive ATM. I for myself simply pull everything out of there anymore.
Posted Using LeoFinance Beta
Thanks for stats. Indeed we are consistent in terms of Users and engagement.
1 User = 1 account?
Posted using Dapplr
rather not
Seems more Steem is being powered up than Hive. Perhaps the power down window needs to be reviewed downwards.
STEEM Token moves are mainly driven by corporate moves of Steemit inc., you can't compare that with HIVE, which reflects the people's actions.
Do you have any evidence of the above statement? More LEO tokens are powered up than Hive in terms of percentage. Is it coincidental that LEO also has 4 weeks power down period? I'll be glad to read your thoughts. Cheers!
I have read that Steemit inc. is mobilizing its assets around two months ago. They move around tens of millions of liquid STEEM to redistribute and synthetically increase the STEEM price. I will not waste time digging deeper, you can use the Explorer yourself and follow the STEEM transfers from and to their main wallets.
Why it's only good that little people power up. They inflate their holdings and I don't
Hopefully, the activity on HIVE will continue to increase!