Hello friends of $SIM, Friends of $HIVE and all others,
here are the:
SIM Statistics for the last week:
The timeframe is from 2021/11/26 - 2021/12/03.
Bought $SIM By Time
This figure shows who has bought how many $SIM at which time:

Top $SIM Buyers and $HIVE Sellers
The inside of the circle shows the buyers of $SIM, ordered by $HIVE they have spent. The outside shows the recipients of that $HIVE (sellers of $SIM):

Commulated Amount Of Bought $SIM Per Person
This figure shows the top 10 $SIM buyers, how much they got and how much $HIVE they spend for this. It is sorted by $HIVE, that was spent:

Table Of Top 20 $SIM Buyers
This table shows the top ten buyers of $SIM sorted by the $HIVE, they have spent:
| buyer.keyword: Descending | Sold $HIVE | Bought $SIM | Avg. Price |
|---|---|---|---|
| @pi-trader | 2569.021815871287 | 4563171.312609249 | 0.0005557711573154845 |
| @dswap | 1000.4712770291619 | 1012454.6316010149 | 0.0013719183750384087 |
| @jelly-cz | 687.3009533849531 | 1231215.4054941135 | 0.0005602864299102553 |
| @jelly13 | 445.83763729712456 | 814131.9112835539 | 0.0005420011495096752 |
| @konvik | 306.4852949756462 | 526488.4634606938 | 0.0005753636307252401 |
| @thegoliath | 265.68212884561785 | 406999.9984643557 | 0.0006778455048333853 |
| @d-pend | 265 | 500000 | 0.0005300000193528831 |
| @svirus | 205.6633017063141 | 362874.900390625 | 0.0005671699930514608 |
| @pokerarema | 125.45732391519414 | 214988.99991810322 | 0.000596550025511533 |
| @enginemaker | 71.57085246942006 | 131606.1357960701 | 0.0005411684029049388 |
| @sbi-tokens | 65.08992004394531 | 116232 | 0.0005600000149570405 |
| @boycharliefamily | 64.87277007102966 | 112813 | 0.0005749924894189462 |
| @kachinhenry | 60.90950474467468 | 94933.06006787112 | 0.0006375940050929785 |
| @hcsparta | 60.508474592226776 | 102554.99867118895 | 0.0005900100222788751 |
| @deepresearch | 58.20000076293945 | 100000 | 0.000582000007852912 |
| @masterful | 54.968457476299136 | 95207.99999621604 | 0.0005669184700729182 |
| @draygyn | 39.48109917365906 | 74499.99915669265 | 0.0005299471584813935 |
| @badpupper | 25.820997535279275 | 43034.99421874806 | 0.0006000000284984708 |
| @theclasser1 | 21.339402809739113 | 37418.886001586914 | 0.0005759780062362552 |
| @dead-door-nail | 20.381510972976685 | 38303.3505859375 | 0.0005332733465669056 |
| @other | 341.5541905075395 | 571172.4816953426 | 0.0005920839065788086 |
Commulated Amount Of Sold $SIM Per Person
This figure shows the top 10 $SIM Sellers, how much they sold and how much $HIVE they got for this, sorted by $HIVE:

Table Of Top 20 $SIM Sellers
This table shows the top ten sellers of $SIM Sorted by the $HIVE, they have got:
| seller.keyword: Descending | Earned $HIVE | Sold $SIM | Avg. Price |
|---|---|---|---|
| @muenchen | 1457.1049978137016 | 2515987.695465088 | 0.0005761426352699729 |
| @konvik | 1060.694498608537 | 1920417.2361668702 | 0.0005674681901423769 |
| @pi-trader | 611.9698050719198 | 955125.5598702952 | 0.0006150385608208609 |
| @jrcornel | 202.31610438227654 | 372547.9979248047 | 0.0005470420117489993 |
| @themightyvolcano | 186.11563873291016 | 334815 | 0.0005554649978876114 |
| @velourex | 165.43712309027342 | 290240.5705000004 | 0.0005699999746866524 |
| @frugal-fun | 161.28012245893478 | 291821.2880859375 | 0.0005544910032767803 |
| @deepresearch | 142.8800048828125 | 100000 | 0.0014288000529631972 |
| @thegoliath | 137.96950936317444 | 245982.91625976562 | 0.0005641900061164051 |
| @steem-hodler | 120.90011978149414 | 219065 | 0.0005542242932798607 |
| @sbi-tokens | 119.800048828125 | 152030.515625 | 0.0007880000048317015 |
| @johannesboldt | 96.70942509174347 | 142836.67950439453 | 0.0005960550042800605 |
| @atomcollector | 95.9853504896164 | 153971.21411132812 | 0.0007821150017358983 |
| @egadacho | 91.19126892089844 | 90288.390625 | 0.0010100000072270632 |
| @svirus | 90.60123920440674 | 155426.4794921875 | 0.0005813137540826574 |
| @imperij4427 | 89.70762825012207 | 161791.078125 | 0.0005464274872792885 |
| @lestrange | 87.64100456237793 | 106092.53125 | 0.0007712833272914091 |
| @dkid14 | 77.93723380565643 | 139443.99743652344 | 0.0005577724950853735 |
| @gamsam | 65.8393839597702 | 120568.00122070312 | 0.0005505400040419772 |
| @intellihandling | 65 | 100000 | 0.0006500000017695129 |
| @other | 1628.5364068862764 | 2581650.3777484647 | 0.000790346201827404 |
Price of the $SIM
This figure shows the price of $SIM for the last period:

$SIM Summarize Metrics
This table shows how much $HIVE was given by buy-requests, that where equal or higher than the sell order vs. sell-requests, that were equal or lower than the buy order.
If the buy-requests where higher than the sell-requests, then money comes into the system and the value of the token increases.
Under the total line one can see the sum of $HIVE and sum of $SIM that changed the ownership and the average price of $SIM for the last period.
The average price of the token in the picture is wrong, actually it was: 0.001 $HIVE/$SIM

Comparison With Other Tokens
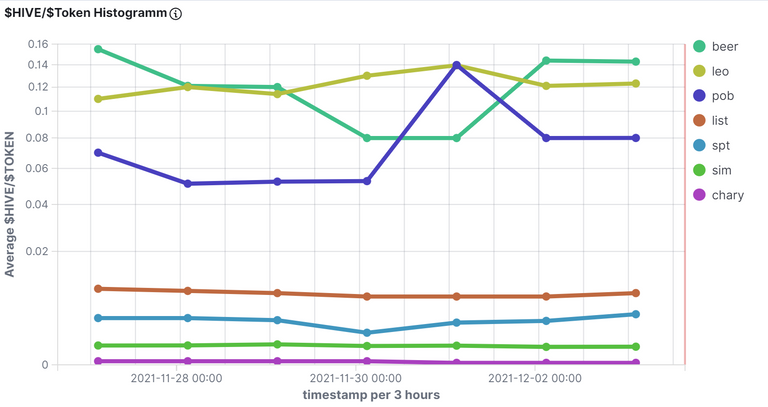
$HIVE/Token
This figure shows the value of $HIVE compared to some token for the last period. Be aware of the nonlinear (root square) y-axes.
US-Dollar/Token
This figure shows the value of $USD compared to some token for the last period. Be aware of the nonlinear (root square) y-axes.
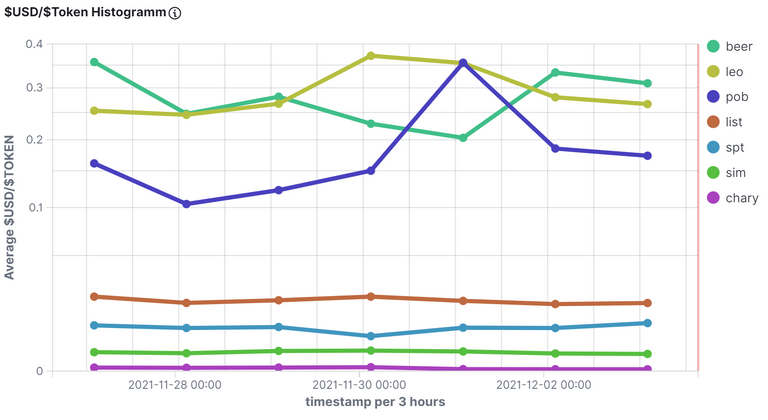
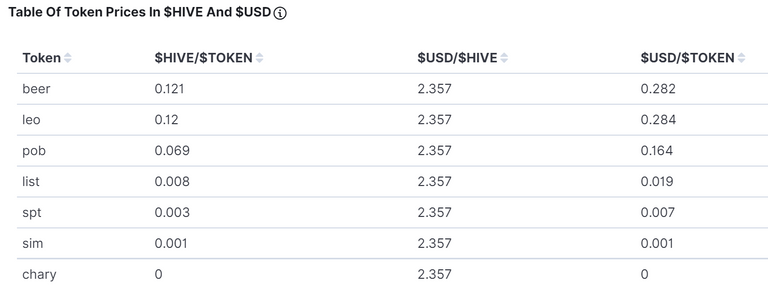
Table Of Token Prices in $HIVE and $USD
This table shows the average value of the prices of the token for the last period. One can see Hive and the US-Dollar compared to the token.
Disclaimer
All stats are without warranty.
They are taken from:
curl -XPOST -H "Content-type: application/json" -d '{ "jsonrpc": "2.0", "method": "find", "params": { "contract": "market", "table": "tradesHistory", "query": { "symbol": "SIM"}, "limit":1000, "offset": 0 }, "id": 1 }' 'https://api.hive-engine.com/rpc/contracts'
I have put them into logfiles and uploaded them to Kibana, from which I took the screenshots.
If you find errors, please tell me!
If you want me to continue the stats, give me some good upvotes ;-)
If you want to see other statistics (even from totaly other data), please contact me. I can create them weekly or monthly if I get some rewards for it.
For more details see here: How I Have Set Up Elasticsearch And Kibana On My Raspberry Pi To Monitor Token Activities and here: Do You Want To See Statistics Of Your Favorite HIVE Token? or on github.
Here are the stats from the other tokens I observe: https://peakd.com/@achimmertens/posts?filter=stats
Regards, Achim Mertens
Thanks for the update !LOLZ you are the man @achimmertens
Aww my bot failed, have some !PIZZA instead
PIZZA Holders sent $PIZZA tips in this post's comments:
@theclasser1(6/9) tipped @achimmertens (x1)
Join us in Discord!
Why you mentioned me just for sell small SIM amount when i bought in one day all SIM available in the market? Do you see graph on the day when SIM was jumping up? Who do you think was the responsible???
hi @intellihandling,
I will check it.
hi @intellihandling: This is what I found from you in my data set, about the $SIM token for the last 30 days:
I can see, that you got 775,148.063 SIM at 2021/11/27, 5:02 AM:
But there was no buying and selling, just a transfer.
My algorythm checks only market buying/selling actions. That's the reason, why your transfer is not found in the figure.
Regards, Achim
Yes, it was a dswap between my company tokens and SIM, but finally i got the big amount and for few days people had profitable game as before the big crash when @dreamm was the president, so i think in your algorythm something is wrong....
Thank you for the info.
At the moment I just watch the transactions an no transfers, so it's just a part of the whole. That's always the problem of statistics. It depends on what you focus.
If I find a way to get a bigger picture, I will implement it.
Regards, Achim
Dear friend, just change this from Dswap to Intellihandling and thats all:
@dswap 1000.4712770291619 1012454.6316010149 0.0013719183750384087
With this operation i moved SIM value to the top since over an year, do you remember when its value was 0.005 (@gerber keep it when you want buy a card with hive!...)
People do not even know why they got for almost a week big amount of SIM rewards of their town, but none say me even thank you!
https://hive.blog/hive-167922/@intellihandling/i-made-an-heartquake
ur mentally challenged bozo