BTC network has had three halvings so far on below dates:
BTC launched 03 Jan 2009
First halving 28 Nov 2012
Second halving 09 Jul 2016
Third halving 12 May 2020
The idea I worked on is to compare the price appreciation and hodl waves appreciation history of BTC for four intervals:
Ist Interval : BTC launched to First halving
2nd Interval : First halving to Second halving
3rd Interval : Second halving to Third halving
4th Interval : Third Halving to now
In order to be able to compare - each interval data series for price as well as for hodl waves is normalized with the start value of that interval. Since price history for first interval starts on 17th July 2010 - so for first interval price as well as hodl waves are normalized with value on this date.
Price History Comparison
Below chart shows price appreciation comparison for above mentioned four intervals
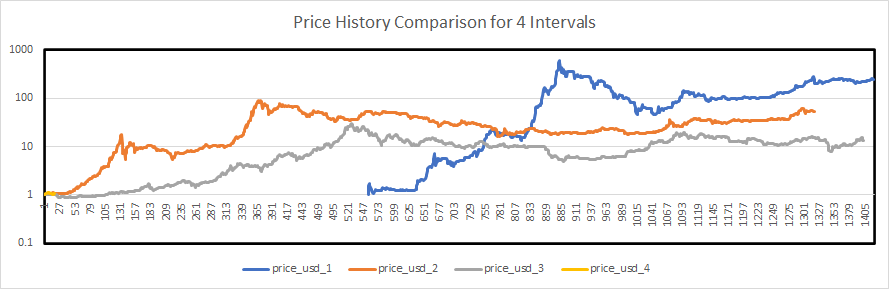
The x axis shows the number of days passed since the start of the interval. And Y-axis shows the normalized price, as described above, in logarithmic scale. Based on this we can make below observations:
- The max appreciation from start to ATH for the interval is reducing with each new interval - 530, 100, and 21 times
- By comparing data for 2nd and third interval - the days taken to max appreciation increases for next interval. Because first interval data starts ~midway so that interval can be discounted.
- By comparing data for 2nd and third interval - the appreciation for the entire interval stays lower than for previous interval. Because first interval data starts ~midway so that observation is violated in early phase but later phase honours this observation.
- The ATH of the interval will arrive when ATH of current interval touches the curve of previous interval i.e. for third interval ATH came around 521 days since the interval started instead at 391 days for second interval
Based on these observations we can expect that in forth interval the ATH will come much later i.e. somewhere in mid 2022 instead of end 2021. And appreciation for fourth interval above start price will stay lower than that of third interval. But when fourth interval curve touches the third interval curve - that will be the ATH of fourth interval.
HODL Wave Comparison
Below charts show hodl wave appreciation for 1st, 2nd, 3rd, and 4th interval:
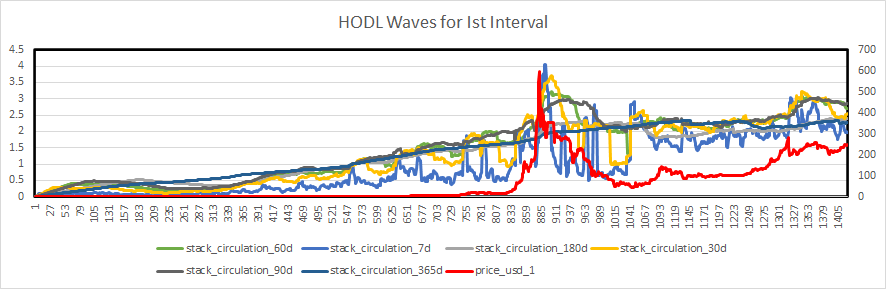
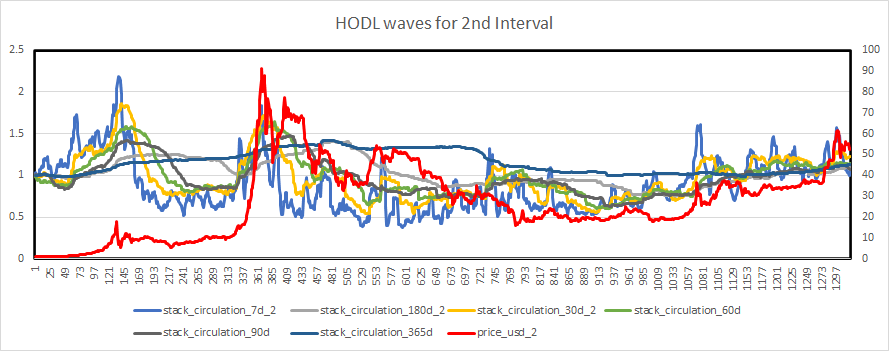
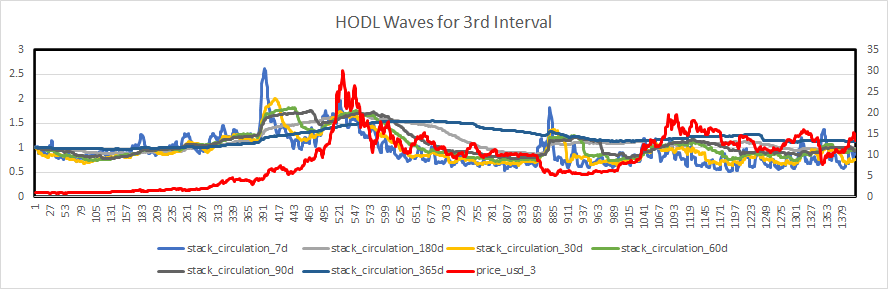
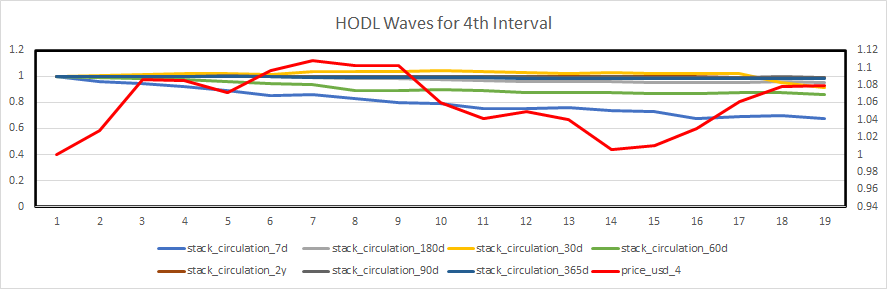
In above charts x axis shows the number of days passed since the start of the interval. Y-axis on left side shows the normalized hodl waves, as described above. Y-axis on right side shows the normalized price appreciation for the interval, as described above. Below are the observations from these charts:
- Before the ATH of the interval - if HODL waves are less than 1 then buy and if HODL waves are above 1.5 then sell
- After the ATH of the interval - if all HODL waves less than 1, HODL waves for 7 days and 30 days are near to 0.5 and 1 yr HODL wave is near to 1 then buy
- During third interval market participants were holding the BTCs to maximum around the same days passed (391) as in 2nd interval and then dumped, expecting repetition of second interval behaviour, but second wave of holding and actual ATH reached around 521 days after the interval started and it is then when third interval price appreciation curve touches 2nd interval price appreciation curve as observed above from price charts.
What to do
For Entry - Accumulate as long as HODL waves appreciation curves are below or near 1.
For Exit - exit when 7days and 30 days hodl waves appreciation curve are near 1.5 and price appreciation curve for fourth interval touches price appreciation curve of third interval.
Lets see how it goes. We will know the results in 2-3 years time. But I will update the study as and when I feel the need for it.
Comments and Feedback is always appreciated