An easy one to read:)
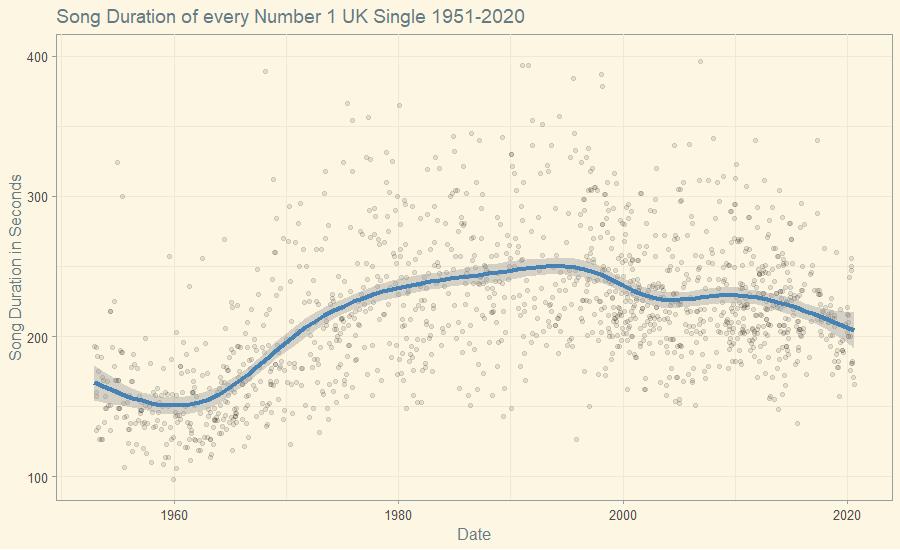
This visualization shows the duration of every Number 1 UK Single, from 1951 to 2020.
If you like the data but don't love the visualization, Luke Turvey, the author, added everything needed in his Github repository :)
I would follow me for a #visualization post every Monday.
PS: I'm preparing something different for next Monday ;)
Don't forget to follow me LinkedIn too!
Hey man, thanks for posting some stuff in my Viz community! That's awesome, hopefully we can get more action going there!
This is pretty cool, the trend was going up for a while but it seems to be going back down. There's a fine balance between a song that's too long and a song that's too short. Pretty cool to show us this, even if it's not something you created but are referencing someone else's! I wouldn't have come across this.
No problem ;) And yeah, there are some clear trends there! Might be easy to predict the duration of the next hit :)
I rarely have time to create the visualizations that I can share as most are client work and protected with an NDA. Also, don't forget to check my LinkedIn! :)