Good evening to everyone . Here is the past weeks staking details.
This is a win -win for both stakers as well as community since it reduces liquid supply .
So I just retrieved the data for the past week -
Note
This contains staking POB data from 4th October to 10th October ( Monday to Sunday)
Data related to POB staking
How many times did users stake in the past week ?
- Last week - 1733
- This week - 1750
How many unique users staked POB?
- Last week - 478
- This week - 547
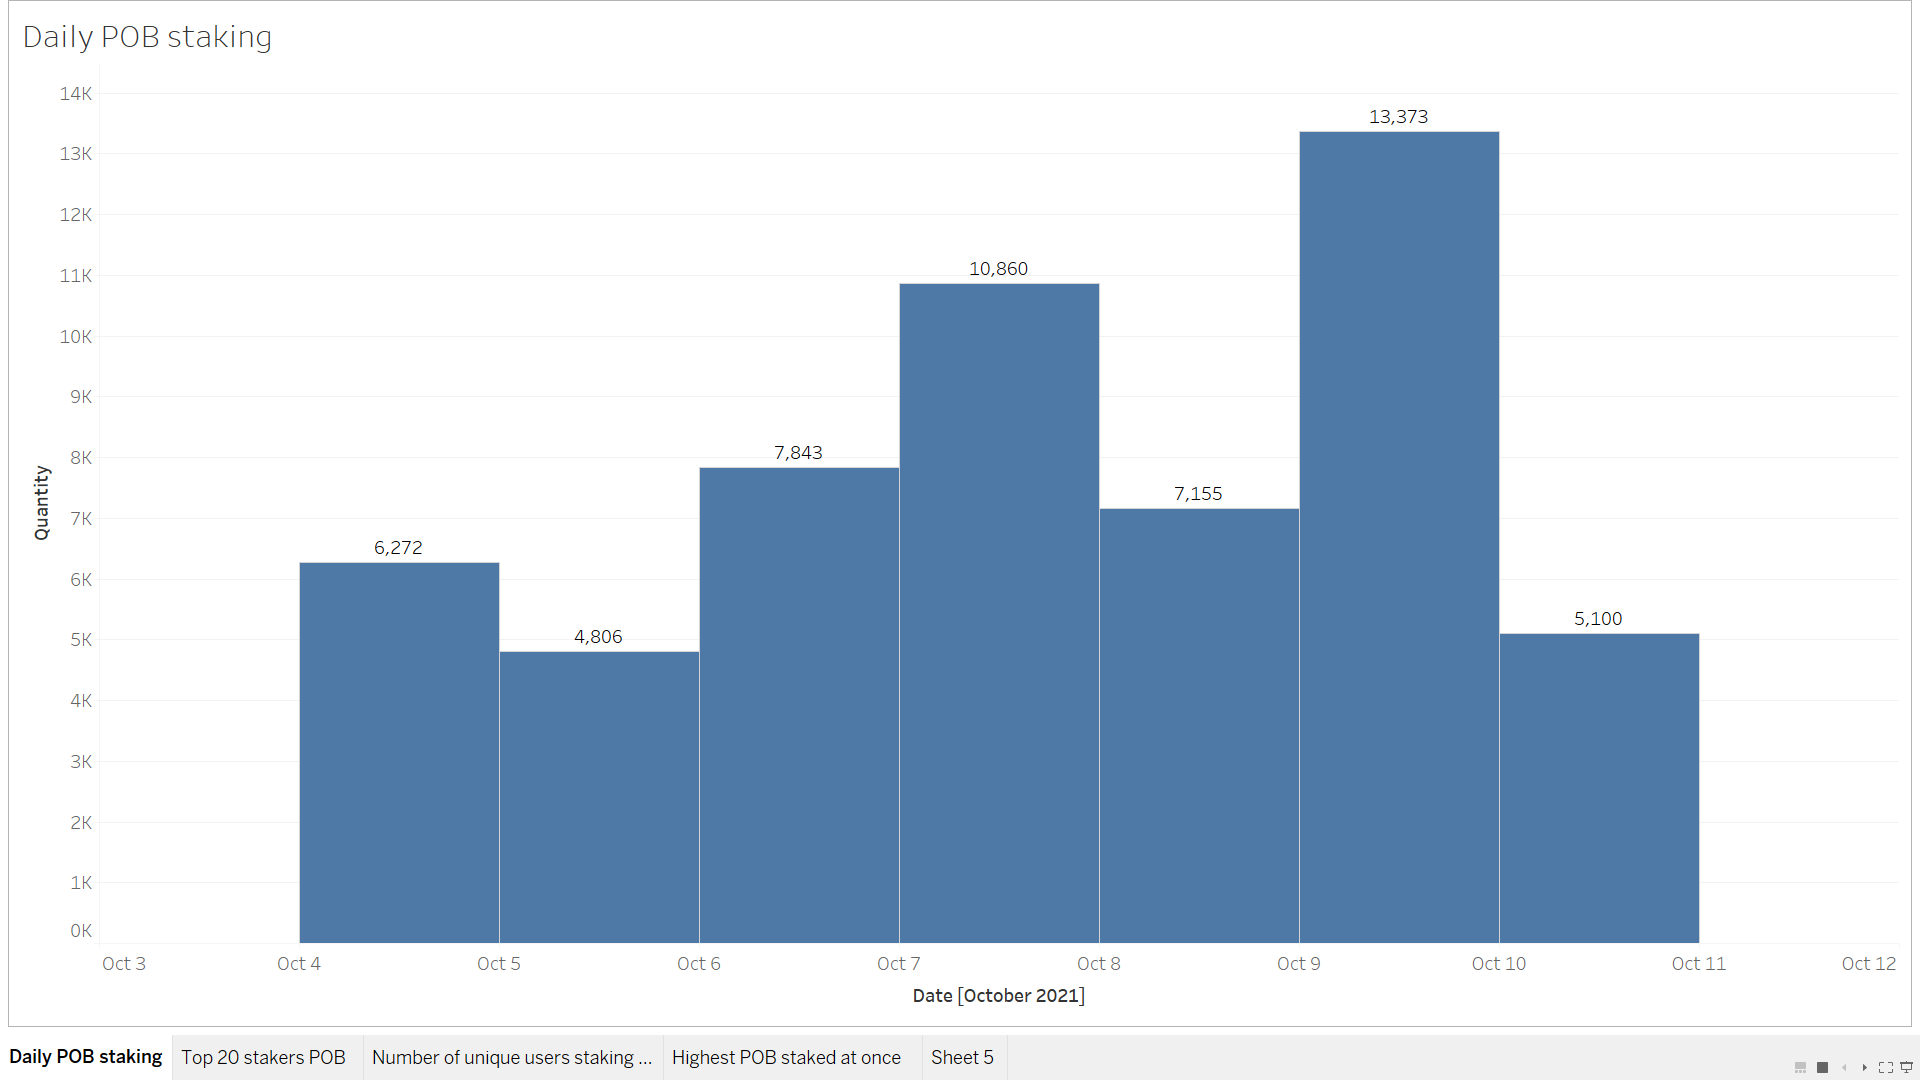
Total POB staked during this period
- Last week - 45776.132 POB
- This week - 55409.127 POB
Average POB staked at once
- Last week - 26.41 POB
- This week - 31.66 POB
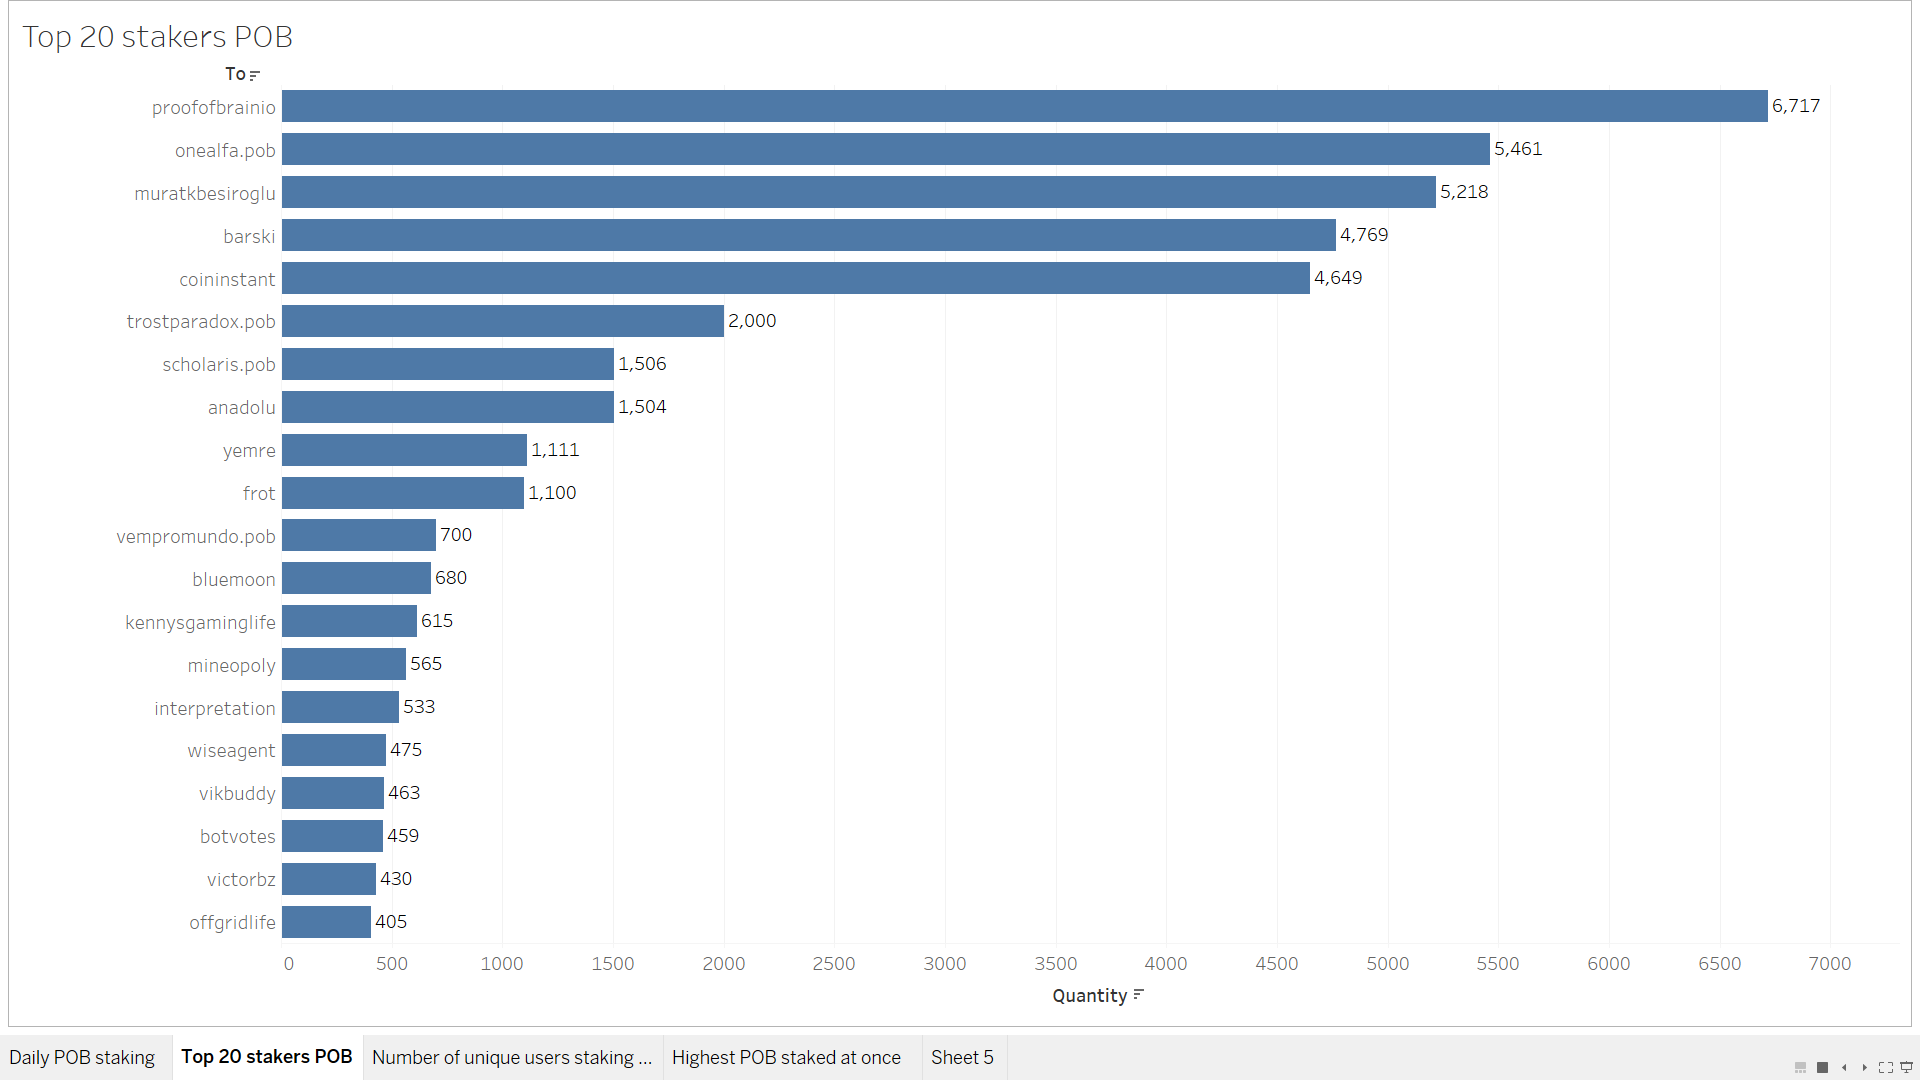
Top 25 stakers
| Account | Amount |
|---|---|
| @proofofbrainio | 6717.129 |
| @onealfa.pob | 5461.0 |
| @muratkbesiroglu | 5217.985 |
| @barski | 4768.623 |
| @coininstant | 4648.643 |
| @trostparadox.pob | 2000.0 |
| @scholaris.pob | 1506.15 |
| @anadolu | 1504.064 |
| @yemre | 1111.0 |
| @frot | 1100.0 |
| @vempromundo.pob | 700.0 |
| @bluemoon | 679.827 |
| @kennysgaminglife | 615.186 |
| @mineopoly | 564.788 |
| @interpretation | 532.863 |
| @wiseagent | 475.0 |
| @vikbuddy | 463.314 |
| @botvotes | 459.107 |
| @victorbz | 430.211 |
| @offgridlife | 404.588 |
| @coloneljethro | 389.999 |
| @shepz1 | 359.353 |
| @anacristinasilva | 358.466 |
| @memeisfun | 337.187 |
| @ezrider | 324.867 |
Data through Charts
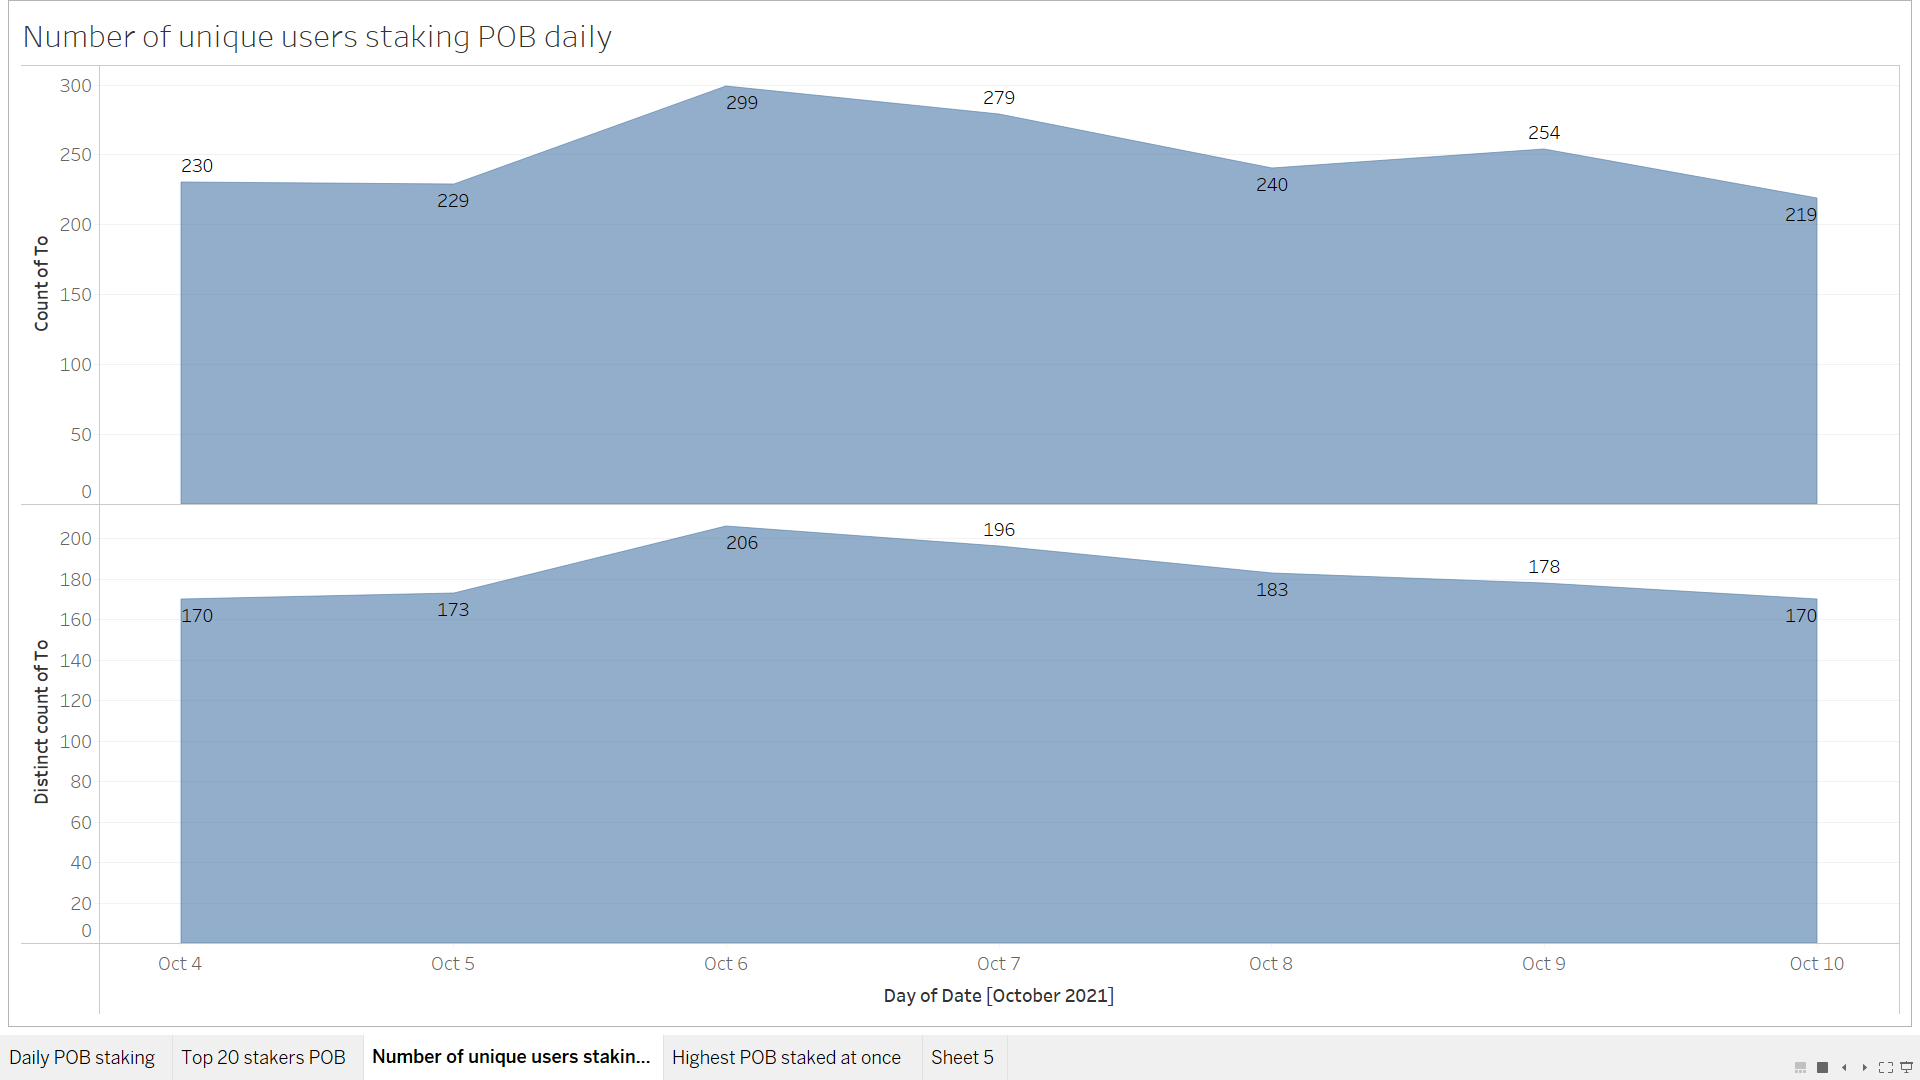
Difference between top chart and bottom chart is that , top chart shows number of times POB was staked but the bottom chart takes number of unique users who staked POB .
So if say @amr008 stakes POB thrice on Monday , in the top chart it counts as 3 but bottom chart it is just 1.
Regards,
MR