
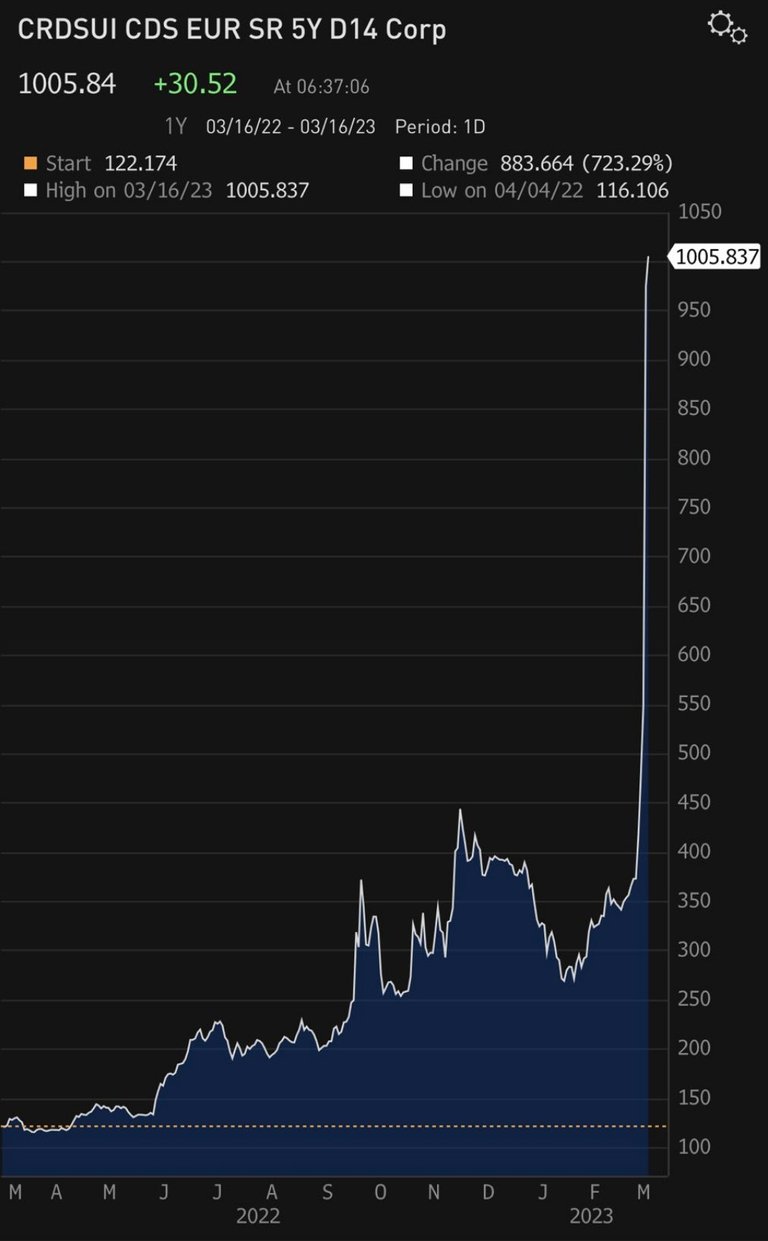
Due to the recent global bank financial crisis and the panic by economists around the world, I think we might be in for huge surprises in the crypto market in the coming months. We've seen the feds do their thing before in 2020 and a similar step is being played in front of our eyes. Seeing Credit Suisse mooning and Billions of dollars pumped into the system means one thing- The Bear Market might just be over
Without further ado. In this post, I'm only gonna talk about the bullish case for Bitcoin from the facts in the charts. Not going to bore you with the ups and downs in the financial world today. So as to continue from where we stopped in February- Majorly about #BTC being in a critical position.. you can read it here , a lot of interesting things happened just as expected
At the time of writing, #BTC
is trading at $27,756. Looking at the facts in the chart, it seems Bitcoin is about to do both scenarios i.e being rejected from the 200MA then dip below $20k And moving back up to flip the 200MA as support which will be massive. Below are some charts that might just confirmed that the bear market is over. I'll try to explain what I think is happening
- Weekly chart
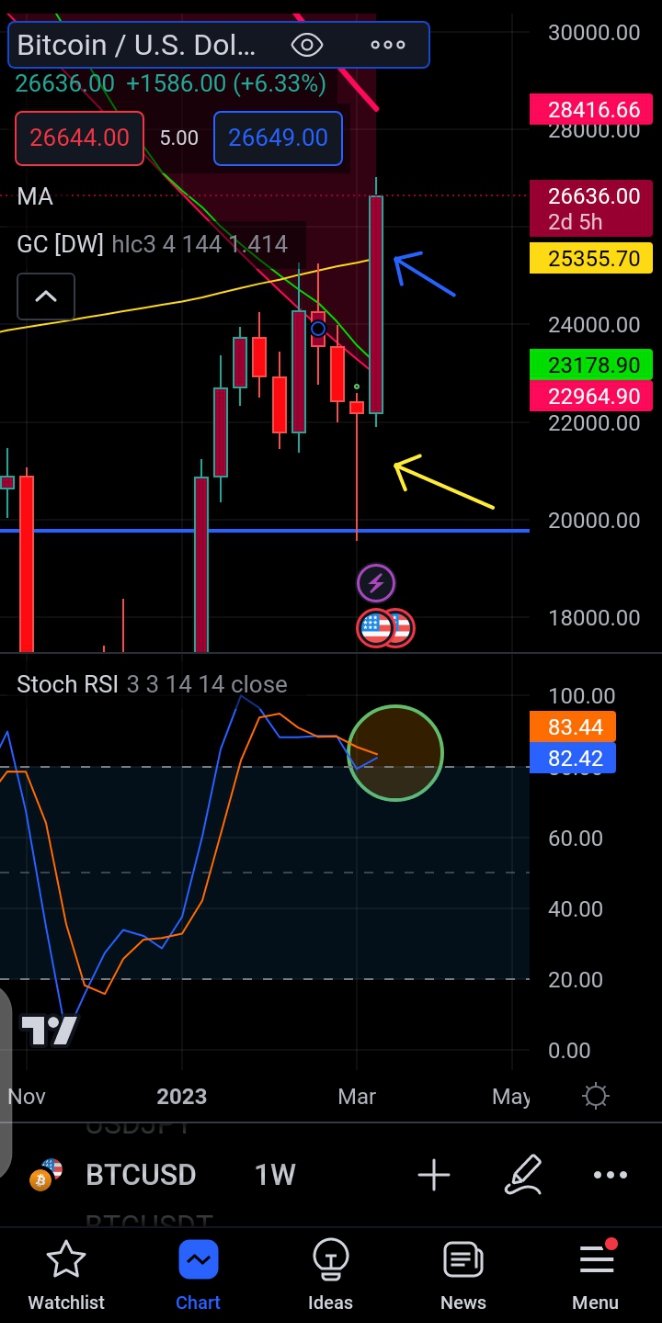
I think there's so much to unpack here🙂.
First is the Stochastic RSI on the weekly, we've shown weakness in a couple of weeks having the blue line crossing down. But recently, we're gaining momentum seeing the blue line trying to cross back up which is a good sign.
The blue arrow points at the level we shouldn't close below😂 which is the 200MA( yellow line). We need to close this weekly candle above this level and also print a confirmation candle for next week above this level, completely flipping it to support 🙂.
The yellow 💛 arrow is pointing to something more interesting. I believe it's saying everything I mentioned above is going to play out nicely. That candle is a Dragonfly doji which is a trend reversal.
- Monthly Charts
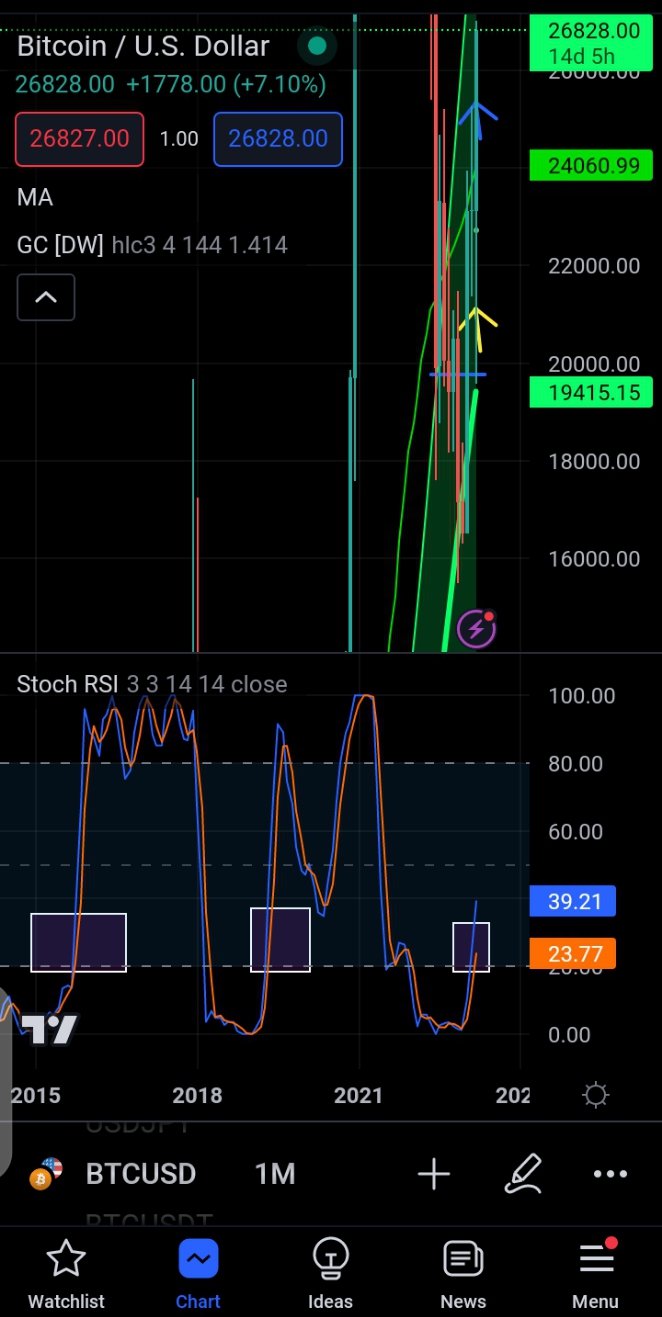
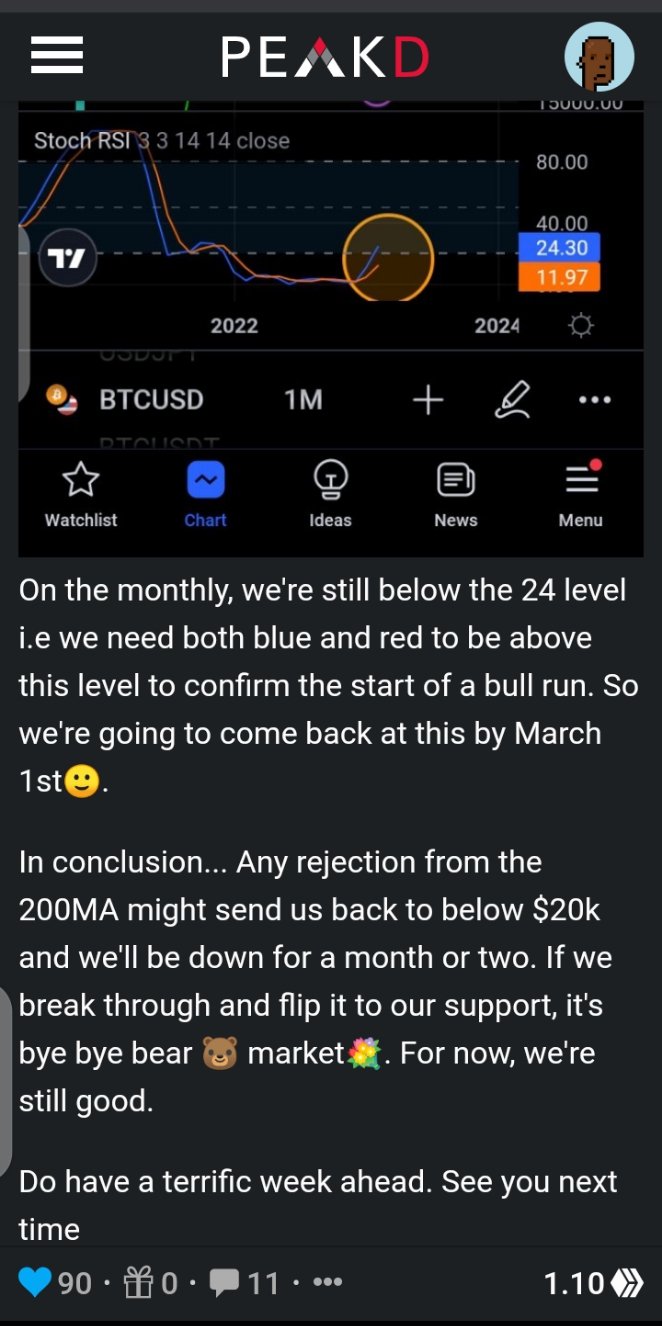
Like I said in the previous post, having our Stochastic RSI above the 24 level marks the beginning of our bull run. Same thing happened in 2018 and 2015. The momentum is on, this might be the last time we'd ever see #BTC at these prices. Men lie, women lie but the charts don't lie 😂.
- Why's $31k closer? 🤔
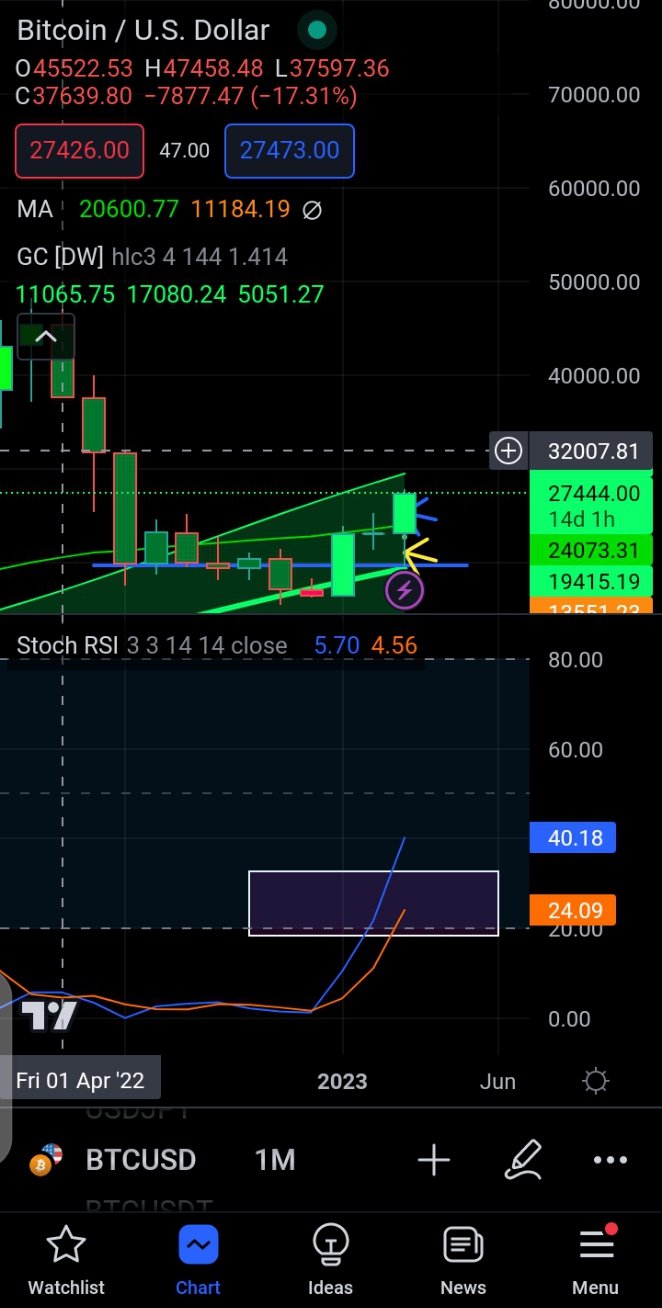
We might see little pullbacks from here to about $26,800 but looking at the chart for about 8months, there's no resistance level at all. Our next resistance is at $32k😦 and that's insane. With the momentum, Dragonfly doji, I think it'll be a smooth ride to $31k by the end of March 🙂.
In conclusion... From the facts in the charts, the bull market has started already. Don't stop stacking SATs. We might not see these prices ever again.
I'd love to have your contributions and criticism in the comment section 🙂. Do have a fantastic week ahead. I'll catch you on the next one.
The rewards earned on this comment will go directly to the people sharing the post on Twitter as long as they are registered with @poshtoken. Sign up at https://hiveposh.com.
Some say it could rund up to 40k before we see a bigger correction/consolidation. 🤞🏻
Watch out for my next post🙂
It's possible tho🙂