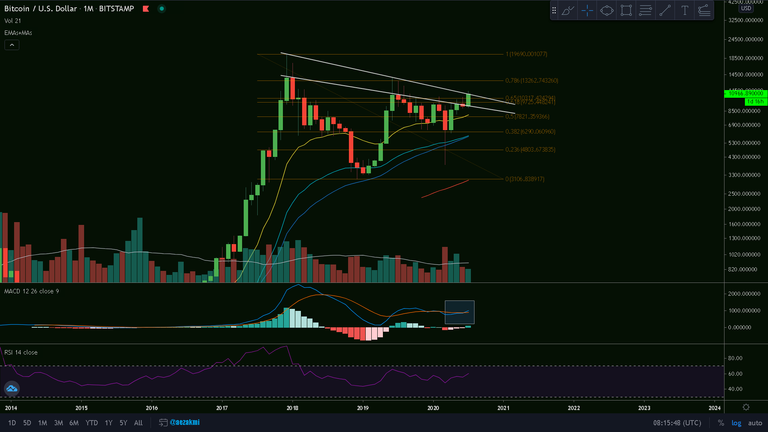
BTC/USD Monthly Chart
With the recent 20% rally, Bitcoin has jumped from the descending body-to-body trend line directly to the descending wick-to-wick trend line! I mentioned this specific trend lines some time ago, in this post!
We are currently right at the upper trend line and the bulls are fighting to close the monthly candle above it (~$10900). As I mentioned before in my previous posts, closing a candle above both the descending trend lines could be the beginning of a new bullish cycle, if not, it could be a very nice short opportunity.
If the bears regain control in the coming period and a nasty rejection happens, we could revisit the 21 monthly EMA (yellow) and the 0.5 Fib. retracement, at ~$7800.
Ctrl + Click here to enlarge the image in a new tab (steemitimages)
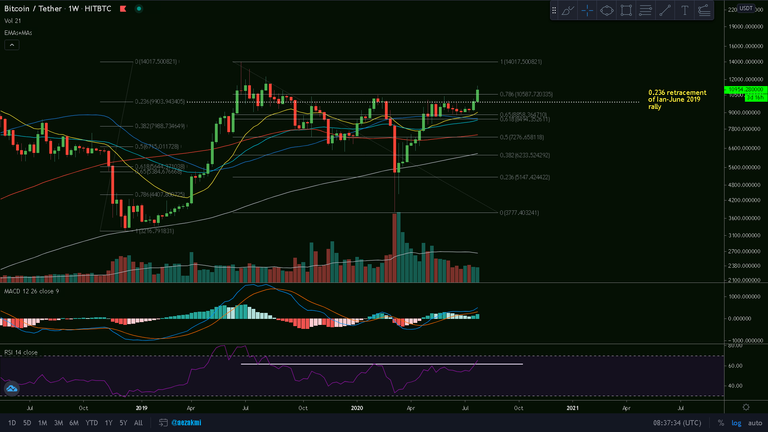
BTC/USD Weekly Chart
On the weekly we finally managed to break the 0.236 Fib. retracement of the Dec. 2018 - June 2019 rally, which I marked with the dotted line. We have also broken the 0.786 of the June 2019 - April 2020 downtrend, together with the 60 RSI level, which marked a resistance level since Q3 2019.
However, the trading volume is not that great and we have a bearish divergence on the MACD - Histogram, but nothing is certain at this point.
Ctrl + Click here to enlarge the image in a new tab (steemitimages)


Thanks for reading and safe trading!✌
If you find this post useful, please:

I don't analyze crypto charts but my gut feeling also says that a bull run is ahead.