Good evening to everyone . Today I will be talking about Hive Power Up Day - famously known as HPUD - and let's see how it differs ( if it differs ) from the rest of the days .
HPUD
You all know about HPUD - Hive Power UP Day . It is 1st day of every month , we are encouraged to power up our Hive on this day and we get badges from HiveBuzz for powering up atleast 10 Hive .
Now I am not going to talk about the June 1st 2021 HPUD specifically because as we all know it will be done by other users who have been taking care of it for months together now .
My post won't add any extra value if I did the same so instead of that I would like to share the data for 3 months and let us see how much the HPUD is impacting the staking of Hive .
3 months data
For the purpose of the analysis I have taken data from 28th February till June 2nd ( Yesterday ) 2021.
Let us not waste anymore time and see the data -
Daily power up data
If you check this you can actually see these things
- There are couple of medium height bars
- Many small height bars
- One long bar
There is only 1 huge bar - 26th April 2021 . On this day we actually saw a huge staking of 800k + amount of Hive .
I actually went and checked what happened on that day and this is what I found out -

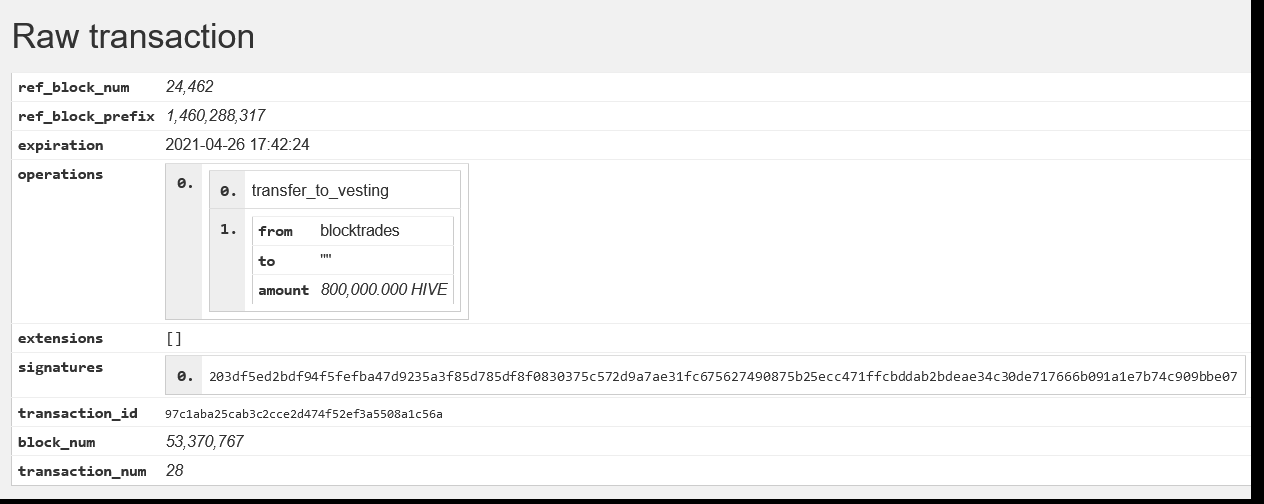
Source- Tx Id
I don't have much info about this particular transaction . I will just leave it at this for now .
But we consider this as an "outlier" which means as you all know - it doesn't fit among other observations.
So let us remove that particular day staking details and use cluster analysis to see what pattern we can see.
Note: this is the exact same data as before with just 2 changes -
- Removing the outlier ( which is 26th April )
- Performing cluster analysis .
Now you can see 3 different clusters here -
- Red - meaning fairly huge staking .
- Yellow/ Orange - medium amount of staking .
- Blue - low amount of staking .
Now let us ask outselves these questions -
- Does all the red bars belong to 1st of every month ? - Answer is NO .
- Does all 1st day of every month has red bars ? - Again answer is NO .
Okay so that means HPUD doesn't have a great impact of amount of staking ? Well we shall calculate that later on .
Number of unique users staking on HPUD
I have already applied the cluster analysis here .
Now this is where you can see the real difference
- Are all red bars on 1st day of every month ?
- Are all 1st day of month fall under red bars ?
Answer for both is YES .
We can clearly see it right ? That means - there are more number of people staking on HPUD than other days .
Merging all days and checking the unique number of users
In the above chart I have taken each day separately for 4 months .
Here I have combined it which means
March 1 and April 1 and May 1 and June 1 = 1
March 2 and April 2 and May 2 and June 2 = 2
Once again I have applied cluster analysis and the result is clear , 1st of every month clearly stands out from rest of the days when it comes to number of unique users .
Let us see the same for amount of hive staked ?
Merging all days and checking amount of hive powered up
See this is why it is important to aggregate and check the results . In the first chart we saw that the cluster analysis didn't show clear distinction between HPUD and other days but here we can see that
- 1st and 26th ( this is purely because of the outlier which actually shouldn't be considered ) falls into Cluster 1 .
- Everything else falls into cluster 2 .
This tells us that in long term perspective HPUD is having an impact on staking of Hive .
Average - Power up
Well it tells that 1st day isn't that big of a difference when compared to other days when it comes to average power up .
But a couple of analysis has taught me that average isn't always the best method when analyzing . Since there is a lot of variation in the amount of Hive power up , the average doesn't provide a good insight .
Median - Power up
Instead , let's see Median .
I don't think this even required any explanation .
This tells us that users wait for the HPUD and then stake . The median value for each and every other day is 0.003 HIVE .
That's it from me today . Let me know in the comments if you enjoy these type of posts . I will continue posting them for you if you like it.
Regards,
MR.
Posted Using LeoFinance Beta
Yes @amr008 the post is helpful to me and i hope the general platform sees that too.
You sharing this shows transparency in all that is going on in the platform and also tells how individuals take part in boosting Hive power.
HPUD is now a tradition to be observed and if we all can take part in this, I'm so sure we will see a positive outcome.
Thank you once again for sharing this I hope to see more of it.
Some interesting stats and it's great to see people powering up on HPUD day. Fantastic!
Posted Using LeoFinance Beta
These are amazing stats especially when you applied the median power up. Tends to absolutely simplify everything. I personally think a lot not people now wait for HPUD to power up this is because it feels significant and it was really interesting seeing the difference in the charts for the past three months.
Posted Using LeoFinance Beta
I guess that makes sense. A lot of people tend to save their stuff up and power it up at the beginning of the month. I have been doing that more lately too. The stuff that I haven't been automatically getting from my rewards.
Posted Using LeoFinance Beta
I have also been saving up and powering up for the most part on the 1st of every month. Well it changed recently due to the backwards savers challenge I started but those tend to be smaller powerups split amongst different days.
It's great to see so many people participate in the Hive Power Up Day though.
Posted Using LeoFinance Beta
To be honest with you , I didn't expect this until I retrieved the data .
It really matters because it shows the concept is working very well .
Posted Using LeoFinance Beta
Great analyses again. I have been participating regularly from last few months. This is like a celebration. I am not surprised to see the spikes.
Thanks for sharing the charts.
!engage 10
You are most welcome :)
I guess I must change my habit too , I usually don't power up at all . Whatever I get from curation rewards and author rewards goes to powered up Hive , that's it .
Posted Using LeoFinance Beta
Before wanting o collect the Hpud Bee's I would power up some small amounts of hive almost on a daily basis, I guess like me some people like he challenge of getting the bee badges.
For sure :) Seems like that . It is good to see people waiting for a particular day so that they can participate in the collective movement .
Posted Using LeoFinance Beta
I liked the analysis that you completed. It is great that HPUD is having an impact. I normally power up my hive everyday so that my voting value will be higher when I start upvoting. Is there an extra benefit from waiting to power up on the first day of the month other than getting a badge?
No not really hehe .
Posted Using LeoFinance Beta