Hi. My last post about Bitcoin was made two months ago. I update the chart regularly. But there is no change in my chart. I'm just stretching the lines. Bitcoin and other cryptocurrencies have experienced a sharp drop over the past week. Many people panicked. They thought bear season had begun. Let's see how the graphics are. Data from Binance exchange. Screenshot taken from Tradingview site. I used the daily chart.
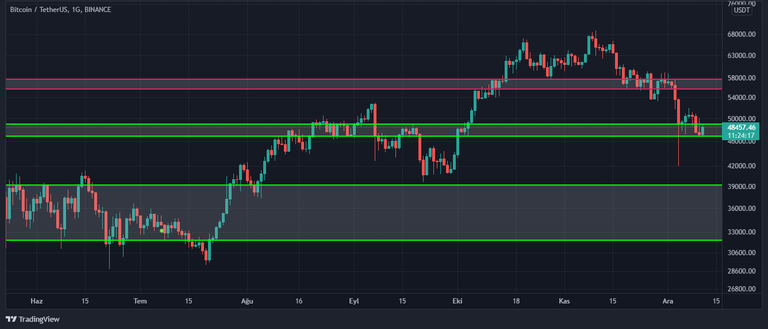
The top red zone crosses the 55700-57700 price levels. These levels and the $60,000 psychological level are important for a possible uptrend. The first level below goes through the 48.900-46800 zone. The bottom wide region passes through the 39000-32000 levels. I usually follow the green zones as 'stop loss' levels.
I usually share my charts about cryptocurrencies listed on Binance and Houbi exchanges. I get data from these exchanges. If you are not a member of these exchanges, you can become a member by following the links below.
Binance: https://accounts.binance.com/en/register?ref=D2P1JVRK You get 10% commission discount.
Houbi: https://www.huobi.com/en-us/topic/double-reward/?invite_code=m9454223 You will get 10% commission discount.
I am not an investment advisor. For this reason, it will be more beneficial for you to see my graphic posts as an educational work. See you later.
Yay! 🤗
Your content has been boosted with Ecency Points, by @anadolu.
Use Ecency daily to boost your growth on platform!
Support Ecency
Vote for new Proposal
Delegate HP and earn more
Have a !PIZZA
PIZZA Holders sent $PIZZA tips in this post's comments:
steem82868 tipped anadolu (x1)
@brianhuang(2/6) tipped @anadolu (x1)
Please vote for pizza.witness!
Have a !PIZZA