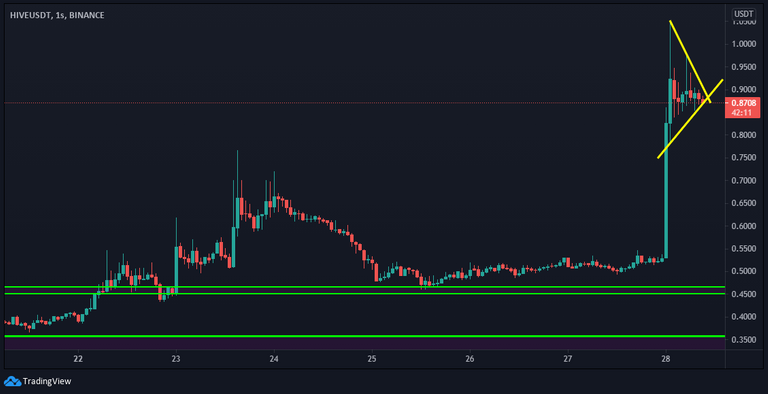
The last time I shared a Hive analysis 21 days ago. Nothing changed in my chart. I just wanted to share a chart for those who do short price tracking. Chart taken from Binance data. From Visual Tradingview.
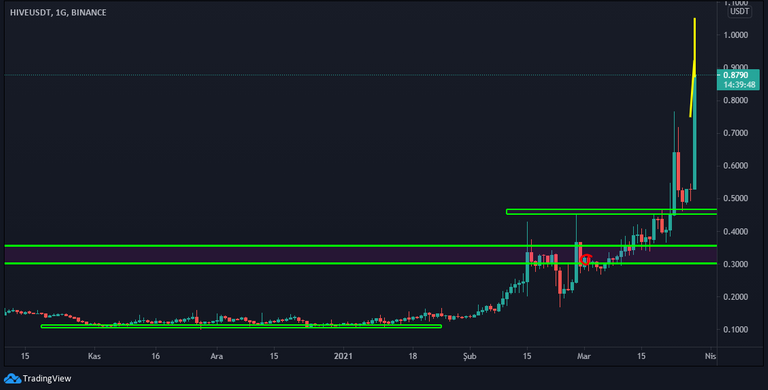
The main graphic I follow;
I do not give investment advice. You should make investment decisions based on your own financial situation. See you in new posts.
(NOTE: Translation was done with Google translate.)
TR
En son 21 gün önce bir Hive analizi paylaşmıştım. Grafiğimde değişen bir şey yok. Sadece kısa süreli fiyat takibi yapanlar için bir grafik paylaşmak istedim. Aşağıdaki grafik Binance verilerinden alındı. Görsel Tradingview'dan.
Asıl takip ettiğim grafik;
Ben yatırım tavsiyesi vermiyorum. Yatırım kararlarınızı kendi maddi durumunuza göre vermelisiniz. Yeni paylaşımlarda görüşmek üzere.
Posted Using LeoFinance Beta
Yay! 🤗
Your post has been boosted with Ecency Points.
Continue earning Points just by using https://ecency.com, every action is rewarded (being online, posting, commenting, reblog, vote and more).
Support Ecency, check our proposal:
Ecency: https://ecency.com/proposals/141
Hivesigner: Vote for Proposal
Can I learn the new support and resistance prices?
For medium term follow-up;
https://peakd.com/hive-167922/@anadolu/hive-technical-level-analysis-hive-teknik-seviye-analizi-en-tr
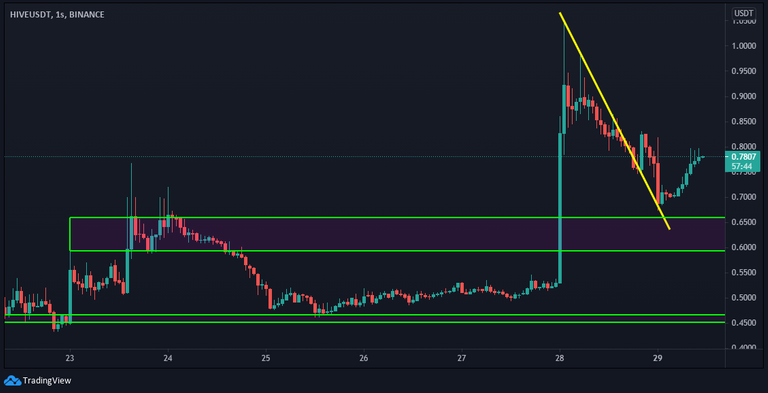
I follow the chart below for daily trading;
It is difficult to move below $ 0.65 if there is no hard sell on the chart. Am I wrong ?