
Trading is now the order of the new world. Trading could be very profitable if it’s well understood. Today I would like to talk about one of the powerful strategies in crypto trading (Price Action). Without wasting time let’s dive into the lesson.

Concept of Price Action
Trading is now the order of the day. Traders in the crypto ecosystem devise different techniques to aid their trading. Technically speaking, price action is the core of every trader. Although others may use fundamentals analysis (News and updates) to trade, every trader requires some knowledge about price action before trading.
Price action is the use of technical strategies, patterns, and technical indicators in trading. Price actions are the core of technical trading. The use of support and resistance levels to identify key liquidity levels.
As we are all aware, the market is controlled by the activities of the traders available in the market. Market makers provide liquidity for market takers. When everybody decides to buy or sell a particular asset at a specific price, the market would certainly moves in a parallel direction with the traders.
Technical indicators are also great tools to aid in trading. Most crypto traders use these technical indicators to confirm signals from the technical strategies. With price action, you can BRB or MSB strategy alongside technical indicators like RSI or moving averages. With price action, you can use flag patterns or even support and resistance levels alongside the MACD indicator.
Price action opens a wide range of trading strategies for any trader.
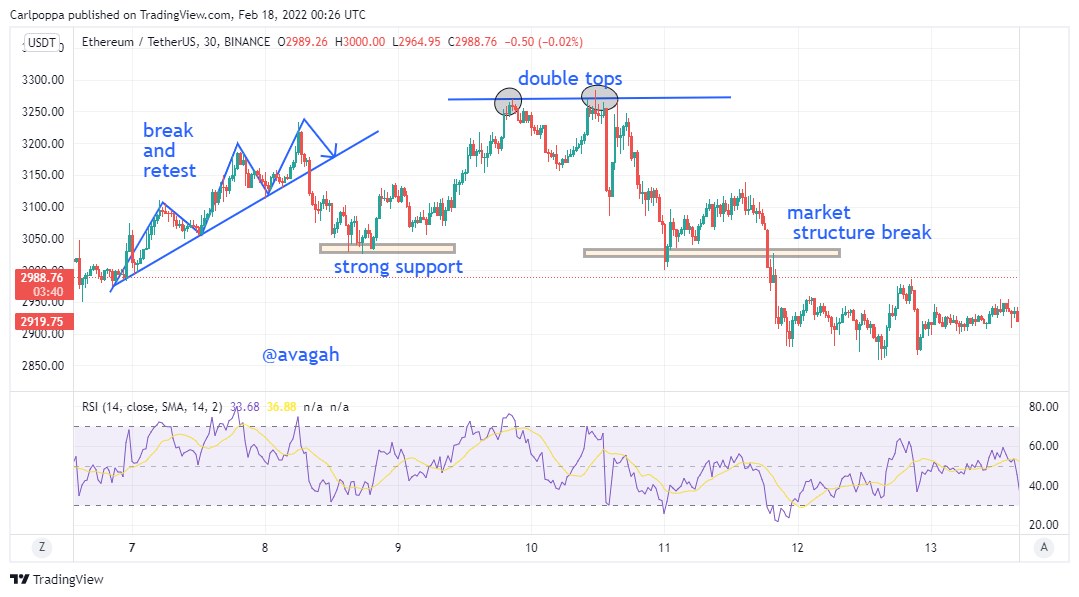
From the chart above, there are so many price action strategies that could be used independently for trading. First, we have the break and retest price patterns that could be used for trading. Price breaks the resistance level and retests back again and continues to break the previous resistance level.
We can see double-top patterns that indicate a sell entry. We can also see a break in market structure which also signifies another trading opportunity. Above all, there's an RSI technical indicator to serve as a secondary confirmation.
Important of price action
Price actions are the core of technical trading. Technical trading involves the use of chart patterns, technical indicators, and technical strategies.
Here are some important price actions;
Price actions help traders to read charts. Without price actions, traders may find it very difficult to determine the current state of the entire market. With price action, a ranging market can be simply distinguished from a trending market. key liquidity levels can be easily identified with price action.
With price action, technical indicators can be used to confirm and spot signals for trading. These technical indicators are also used to spot divergence in the price patterns and also filter out false signals which may mislead traders.
Price action gives foreknowledge to traders before they enter the market. Every good trader would like to have some knowledge about the chart before they enter into any trade. Sometimes the market becomes too easy to predict. When there's a break in market structure, the market communicates reversal to the traders but sometimes they turn out to be just fakeouts. However, with price action and good psychology, these hindrances could be avoided.
The obvious is not obvious
In my opinion, Price action is the best technical analysis. Without price action, trading would depend sorely on gambling and fundamental analysis. Price action communicates very good techniques to traders.
The Japanese Candlestick Chart
Just like many other charts, the Japanese candlestick chart is used to represent the price behavior of an asset graphically. As the name implies, the Japanese candlestick chart was invented by a Japanese trader Munehisa Homma in the 1700s to describe the price behavior in the stock market.
Unlike many other charts, the Japanese candlestick chart provides a depth description of the price behavior of the asset. These candlestick charts do not just graphically represent the price behavior of an asset but help to predict prices and trends. In crypto trading, experts use the Japanese candlestick chart to make some technical analysis to be able to predict the prices of the asset before trading.
Considering a typical situation, without the Japanese candlestick chart traders cannot use the Break Retest Break (BRB) and the (MSB) strategies since they require some information on the candlestick charts. There are numerous technical strategies enhanced by the candlestick charts to predict prices during crypto trading. Moreover, technical indicators are enhanced by the Japanese candlestick charts.
Why I prefer the Japanese Candlestick Chart
As I said earlier, the Japanese candlestick chart not just graphically represents the price behavior of the crypto asset but also helps to predict trends and the price behavior of assets. The candlestick charts give precise details about the price behavior of an asset. Compared to other charts like the line charts and bar charts, the Japanese candlestick charts give better approximations of the price within a specific period.
As I also said earlier, the Japanese candlestick charts are used by expert traders to make some technical strategies before trading. Technical strategies like the contractile diagonals, BRB, and MSB are all enhanced by the Japanese candlestick charts. Without the Japanese candlestick charts, all these strategies may not be efficient as it seems.
The use of technical indicators like the RSI, ADX, Vortex, William %R, and the others are all enhanced, by the Japanese candlestick charts.
Basically without, the Japanese candlestick charts, crypto trading would be very difficult since trends and price predictions wouldn't be precise and reliable. Traders would find it very difficult to predict the (highest, lowest, open, and close price) within the period
Multi-timeframe Analysis
Good traders use multiple tame-frame to make an analysis. Multi-timeframe analysis refers to analyzing an asset in more than 1 timeframe. The multi-time frame analysis is usually associated with scalpers.
Before a good scalper analyzes a shorter timeframe, they have already analyzed the longer timeframe. Usually, the longer timeframes are used to identify the long-term trend of the asset, While the shorter timeframes are used to identify trade signals.
Scalpers use the hourly or daily timeframe to determine trends, while the 30 and 15 mins timeframe are used to identify the trade signals for trading.
Likewise, swing or long-term traders use weekly and monthly timeframes to identify the trends of the market and execute trades with hourly or daily timeframes.
I would demonstrate a typical example of multiple timeframe analysis.
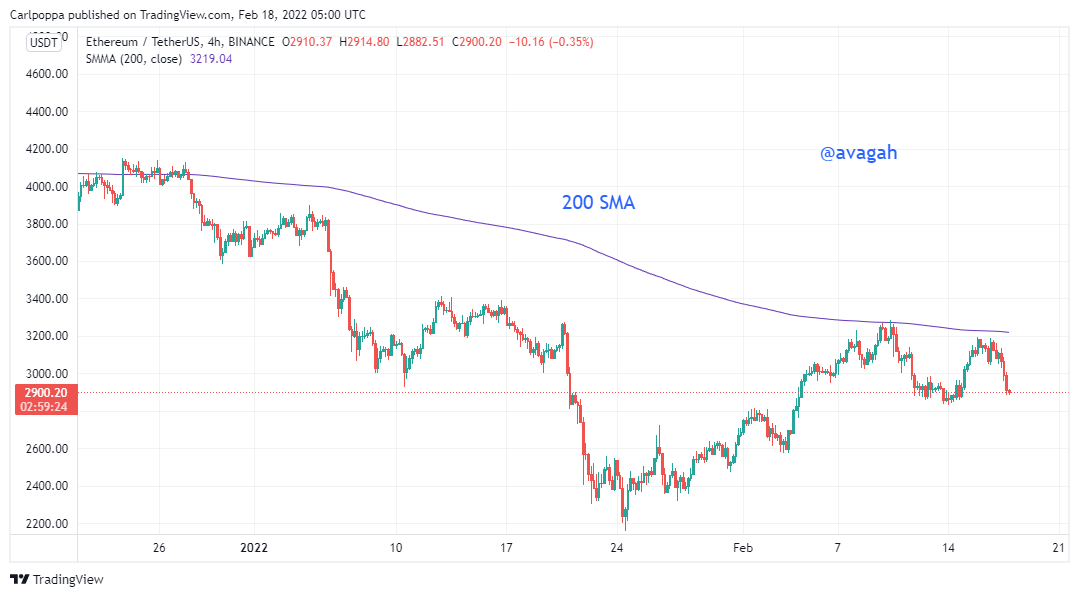
From the ETHUSDT chart above, we used the 200 SMA to determine the general trend of the ETH over the few weeks. Here, we realize the whole trend is still bearish since the price falls below the moving average. After identifying that it's bearish, we try to find selling opportunities or sell signals.
Here, we would use a small timeframe to find the signals.
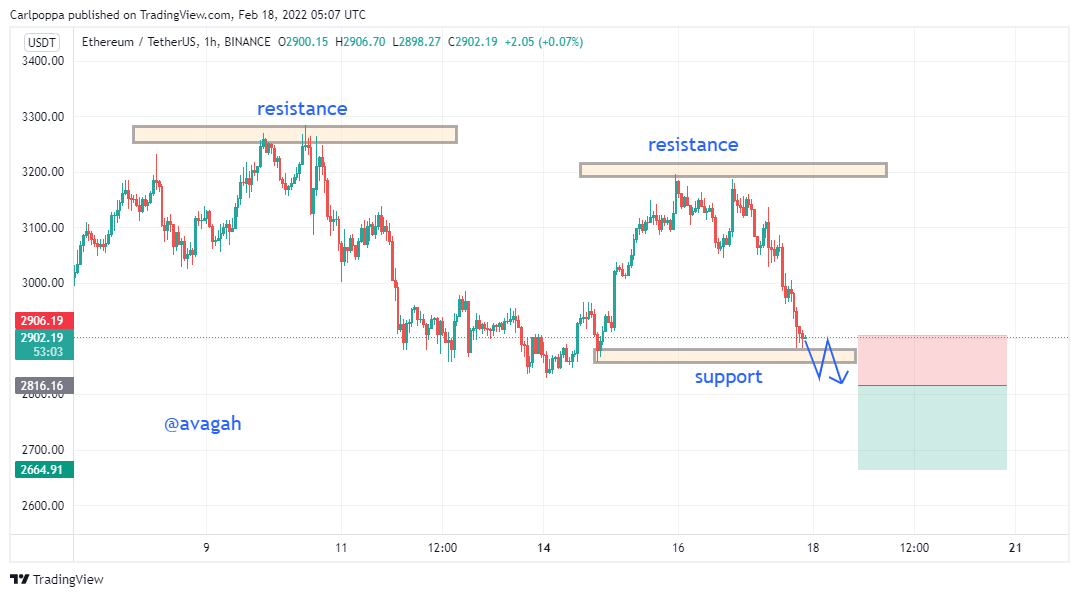
From the chart above, I have indicated some key levels. Here, we cannot just enter the sell trade because the longer timeframe is bearish.
Now we allow the price to break the key support level as I have indicated in the chart above before we can confidently enter the sell trade.
The market can pull back before it breaks the key level. In any case, it is very advisable to wait patiently for confirmations before we enter into trade.
Importance of multi-timeframe analysis
Trends are identified clearly before trades are executed. As we are all aware, identifying trends is the priority of a good trader.
False signals are eliminated since the analysis was not done in one particular timeframe. Usually, scalpers are trapped in many false signals. Smaller timeframes cause many problems for inexperienced traders. Sometimes the trend on the smaller timeframe may look very different from the one on the longer timeframes.
Analyzing a longer timeframe can yield more profits. Sometimes you can even set a 1: 8 risk-reward ratio when analysis on the longer timeframes becomes very obvious and simple. Imagine catching the whole new reversal trend on a 1-Day timeframe where the trend could continue for weeks or even months.
Chart Analysis
Here, I would analyze the 1-day timeframe and trade it with the 4-hour timeframe. just like a swing trader.
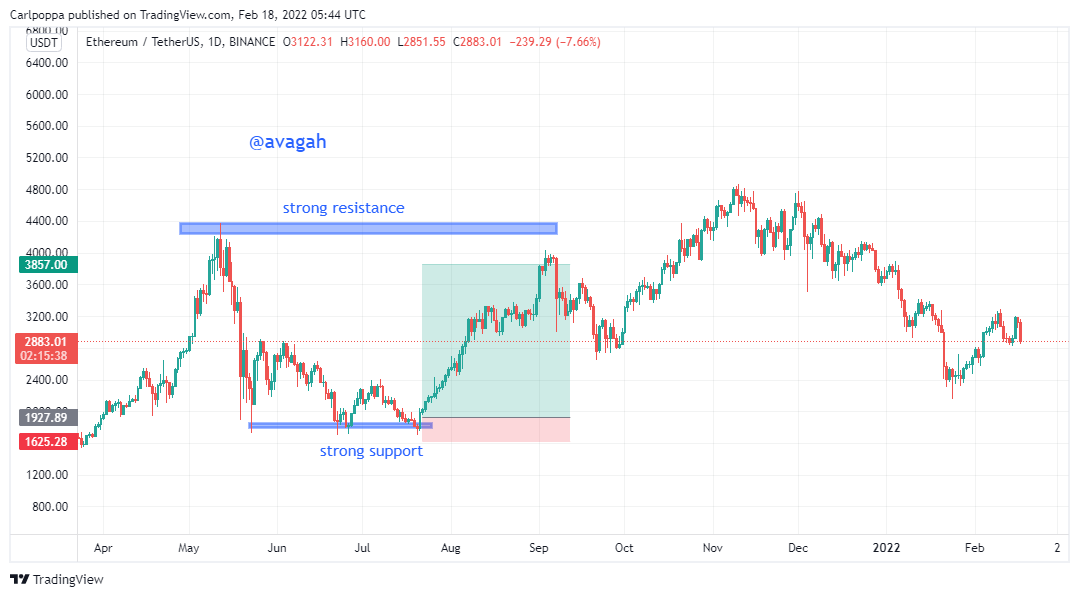
According to the 1-day timeframe, the strong support and resistance level are very clear.
We identify these levels clearly and wait for the price to reach these levels. However, Since a triple bottom was formed, the support has been confirmed to be very strong support. Now we place our entry when we identify a clear bullish candlestick.
Here, we can set a very tight stop loss since our support level has proven to be very strong.
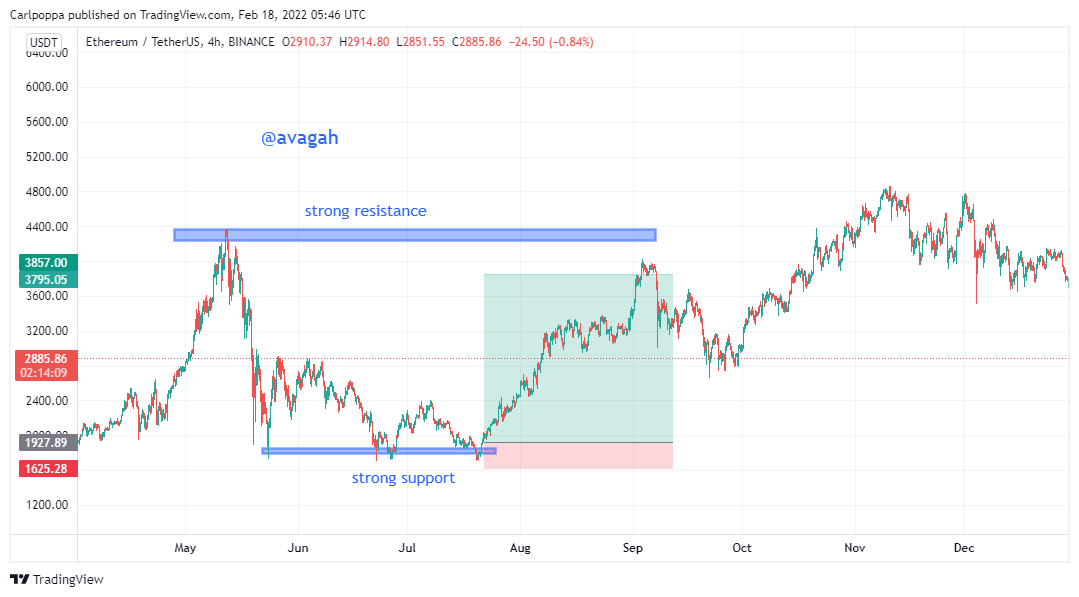
In the 4-hour timeframe where our trade was executed, the price action looks very similar to the price behavior in the 1-day timeframe.
As we can see from the chart, the stop loss is very tight and our risk reward is about 1: 7 or even 1:8.
Overview
Price action is the most common and effective technical strategy used by most expert traders. The strategy is very simple to use and effective as well.
However, I would recommend the use of both fundamental analysis and other technical indicators alongside this strategy. This is to increase the win percentage since no strategy is 100%.
From my experience in trading, I realized there are numerous strategies used by different traders. I would recommend any traders stick to some 2 or 3 strategies and master the technique very well. It is very advisable to use good risk management as well. Do not risk money you are not willing to lose.
Price action makes one to understand and see the reality of what is happening at the market at that moment.
Price action is the core of trading