Following my complete analysis on bitcoin that was published a day ago, here comes the complete analysis on ethereum. On the 11th of May 2020 occurred the bitcoin halving with diminishing of the BTC rentability for miners. As always and as long as traders trade Altcoins following their bitcoin strategy, biggest Altcoins like ETH follow the BTC movement somehow. It is then time to rethink the ethereum analysis to restrategize the trading plan.
Exactly as I did for bitcoin, I will try to implement all the informations that I have to be as precise as possible. Also, this article will be the evolution of the last one concerning BTC and ETH together that has been published right before the halving.
Plan
- Weekly
- Daily
- Conclusion
- Final Word
Weekly
Technical drawings
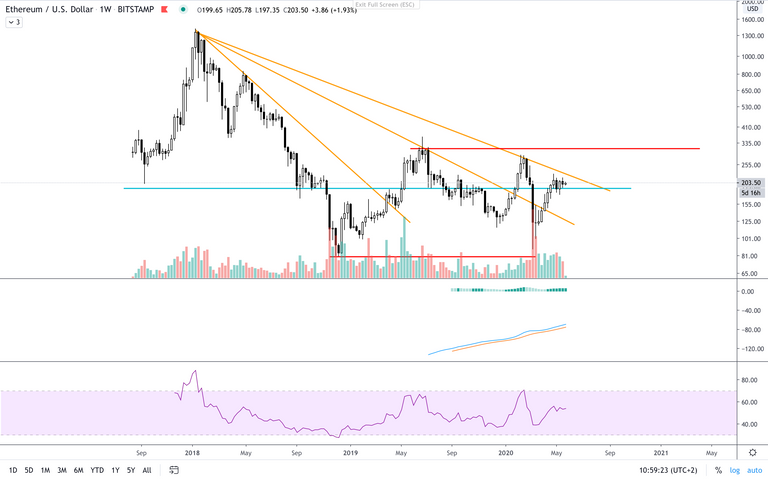
On the technical side what was expected after the halving is somehow coming. We're losing some terrain and getting away of that double bottom validation level. We didn't even closed the last descending trend line. But it is for now holding a level of historical importance around 190$/ETH (turquoise line).
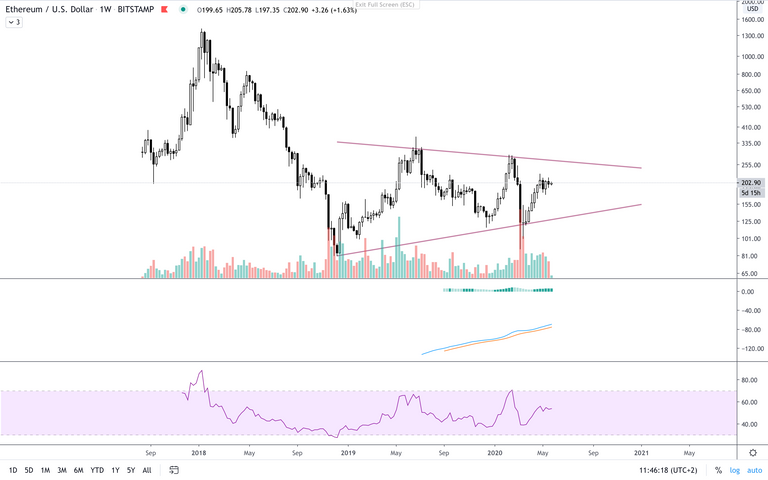
But when we try to clean the view a little we can see this symmetrical wedge appearing. For now I will put it aside and I'll come back to this one in the conclusion.
Exponential moving averages
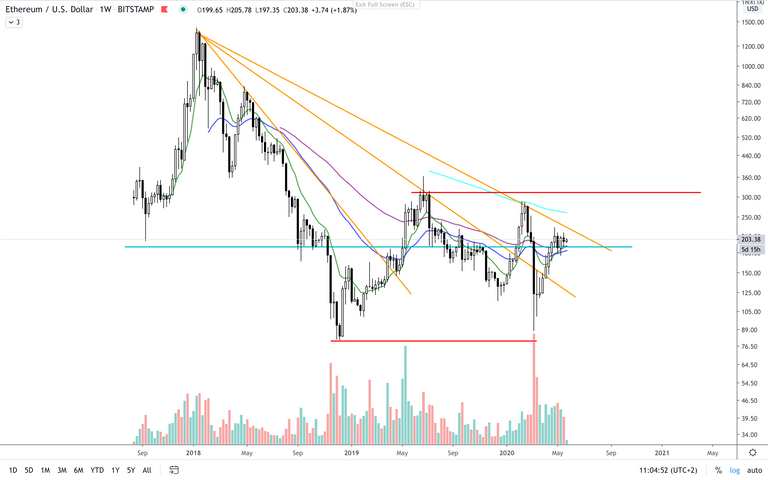
Price is evolving since April 2020 above EMAs 26 and 50, but since ethereum's creation weekly EMAs 26 & 50 were always upside down. By the time they reverse their position and 26 comes over 50 we will confirm a magnificent long term bull-run. However, it is still not the case today.
Ichimoku Kinko Hyo
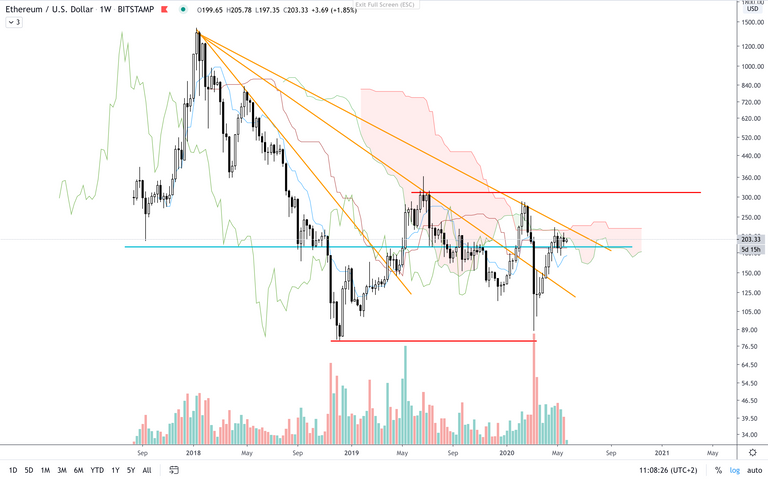
On Ichimoku's side we're not bullish either. Price has managed to cross once the cloud in February 2020 but it was to be quickly pushed back under it. At the moment it is evolving under the cloud and for the moment it faces difficulties just entering the cloud.
Daily
Technical drawings
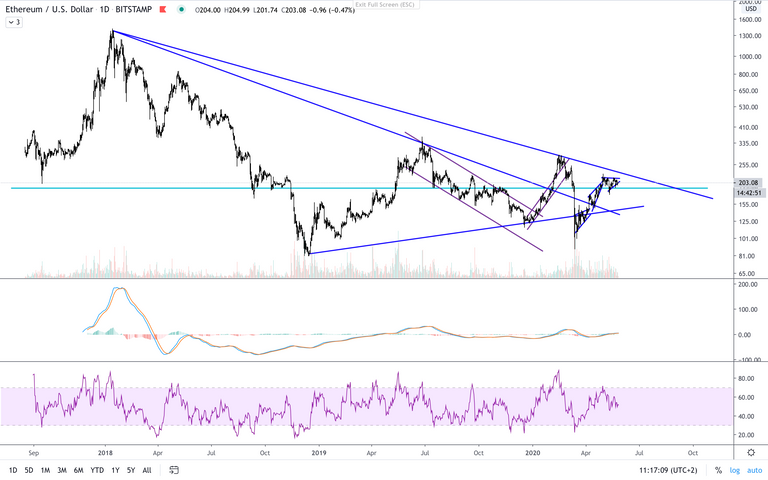
On the large view we find our 190$ level that was defined on the weekly TU. This level is still very important on the daily time unit as we can see here. During the last months it was around this level that trend reversals were decided. And once again we're working a lot around that level. After two consolidation movements ETH went above that level and now it has restrained its growth and is hesitating in its uptrend right above the 190$ level. Let's see what the indicators tell us.
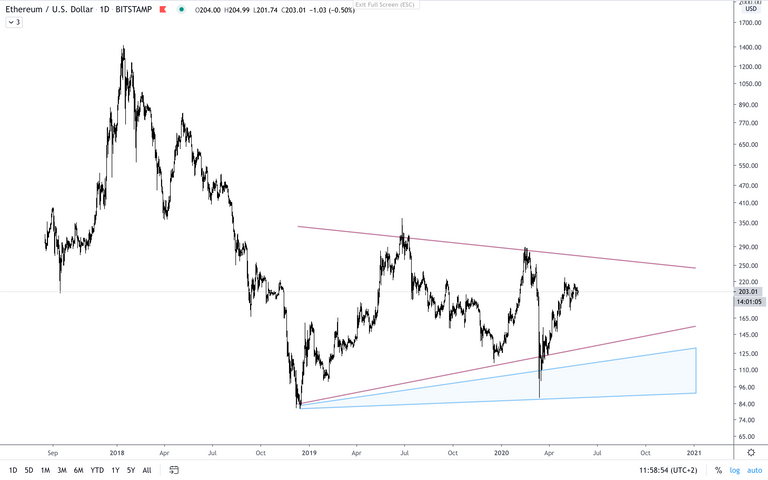
As promised earlier, here comes back the weekly symmetrical wedge. I have added under that wedge a zone defined by the long term trend lines drawn using closing and extreme daily prices. In case of a trend reversal and a weekly price coming back to the wedge's bottom, this zone is where I expect the price to fall down before pushing back again into the weekly triangle.
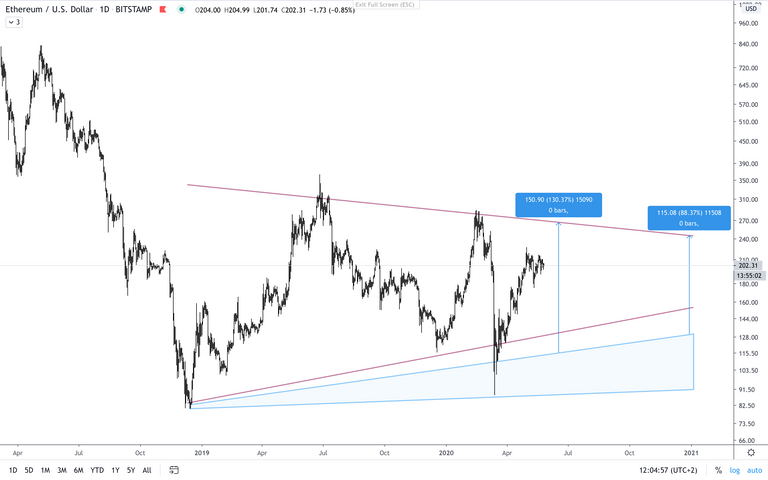
Limits of this zone are quite large and oscillating between 85 and 120-130$ depending on where you look, but even if you buy at the highest possible price and wait for ETH to reach symmetrical wedge's top again you would at least accumulate a +80% gain as you can see in the following chart :
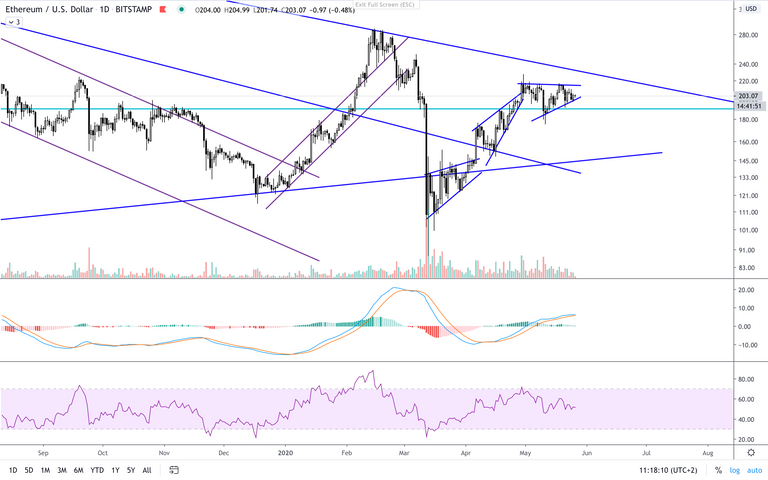
Exponential moving averages
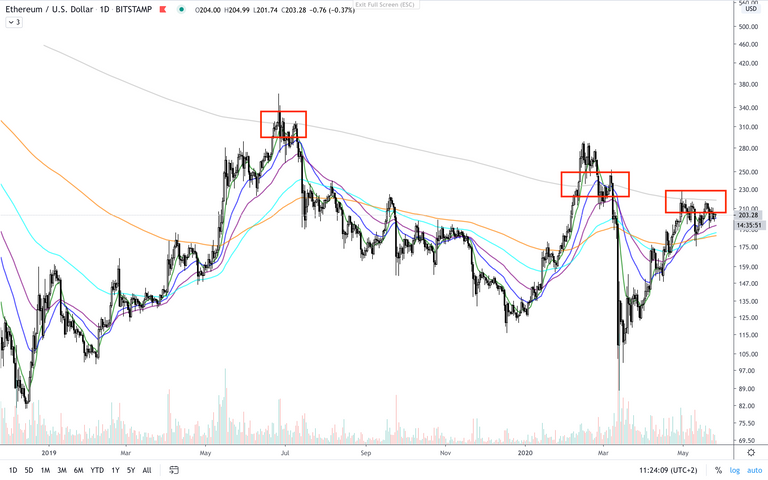
For the moment we're still on an uptrend regarding EMAs 26 and 50. Price is actually retesting EMA 26 as a support level and this could be decisive in the continuation of the actual uptrend or its reversal. But exactly as we could determine the 190$ level with technical drawing we can here define an EMA level with EMA 500. In ETH's history, each time it came close it has been rejected immediately or right after trying to cross it. So for now price is being compressed between EMAs 26&50 and EMA 500.
Ichimoku Kinko Hyo
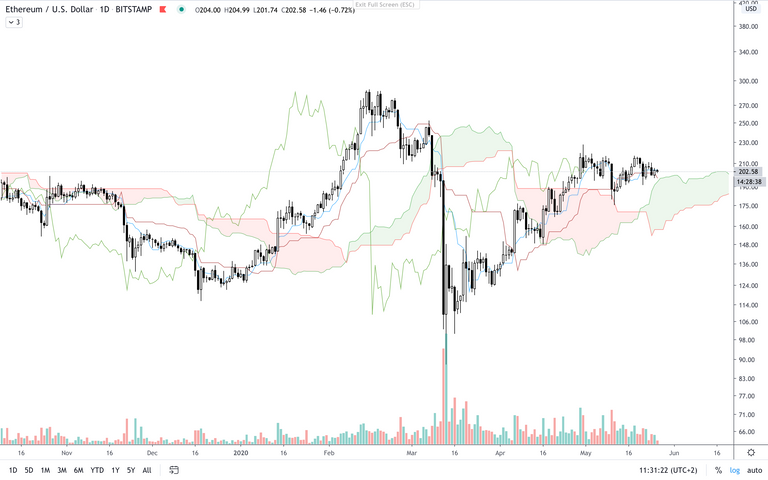
Ichimoku's analysis may come to the conclusion that we're having a trend reversal. Price is heavily fighting with Kijun daily and at the same moment when the movement seems to be slowing and beginning to nosedive.
Conclusion
- Long term cycles : for those cycle I would strongly recommend to read my last article about bitcoin. I know people looking for ETH don't like to compare it to BTC, and so do I. But as long as professional traders apply the same strategies to Altcoins as they do to bitcoin, long term cycles will somehow look the same on the biggest altcoins and bitcoin.
- Middle/long term : a long term uptrend will be confirmed when EMAs regain their bullish positions (EMA 26 over 50 and price above them) and if ETH manages to run to the double bottom validation level above Ichimoku's Cloud. Also I would keep a very close eye on the 190$ level as it represent a very strong support/resistance area and a crossing of this one would send the price back into a bear-run.
- Short term : a trend reversal seems to be very likely in the next days. It is important to watch very closely daily's EMAs and this famous 190$ level. In case of a down breaking I would sell off and protect my funds, waiting for the next entry door.
-- - Overall conclusion : comparing bitcoin and ethereum long term cycle, I think in the long term we have a very nice bull-run awaiting and slowly getting prepared. However, this long term trend isn't protected from other lows in the way, lows that shouldn't get under 80$/ETH. Actual price analysis let me think we're slowly having a short term trend reversal that may very well come to one new low in the next days/weeks.
- Stop loss : daily price closing under EMA 50 and under the 190$ level, followed by a new buy as soon as the price comes into the blue zone under weekly wedge (or re-evaluation at this level/at wedge's bottom in case of new signs appearing)
- Buy order : weekly price closing above symmetrical wedge (around 250-260$)
Final word
If I had to compare conclusion of this article to the previous one, I would stick to the same position. I am not expecting a strong uptrend right after the halving that happened to be on the 11th of May 2020. I am still watching closely the market as it may come to a new low in the next weeks or even days perhaps. My goal now is to play safe in the next days not to lose money but to be prepared to take advantages of a new low entry door. And if it doesn't come then I'll buy at the weekly symmetrical angle break out.
However there's something that hasn't been discussed until now : the transition to ETH 2.0. It has been postponed several times but it looks like now things are on the right way and it should happen by the end of the year (don't hesitate to correct me in comment if I'm wrong with the timing). As this evolution will bring ethereum project in a complete new era, it could very well influence the ETH DeFi network and somehow change all market analysis. This is very promising but we'll have to wait for the year to progress to see if ETH 2.0 is finally coming to life.
As I have been writing a lot about bitcoin and ethereum, there's still one question that is always difficult to answer : which one to hodl in your portfolio ? Previously I was strongly voting for ETH portfolio, lately the movement seemed to be more in favour of BTC. But will it stay that way ? Will it change again ? This will be the subject of my next article that should be published in the next 48 hours !
Next article in line to be published :
- ETH/USD - Ethereum new complete analysis - Immediate post-halving time
Previously I was strongly recommending my followers to hodl ETH in their portfolio, but lately the movement seemed to be more in favour of BTC. But will it stay that way ? Will it change again ?
Stay updated threw the different channels :
Don't hesitate to tip to support my work and help my researches.
ETH address :

0x3afdd2FEdd6F2DA6Bb7EB8fc5F901eC12dE8B239
BTC address :

1MfeTDWqSEY3L9PPSw9iF6dtA1bN9HvSSo
BAT address :

0x3afdd2FEdd6F2DA6Bb7EB8fc5F901eC12dE8B239