I’ve heard a lot about candlestick charts and the importance of understanding them over the years. Although a true appreciation and understanding of an analytic tool like these charts can likely only come with years of trial and error, I think it is important to at least scratch the surface of financial charts if one is dabbling in any market.
In the simplest terms, a candlestick chart is a style of financial chart used to describe the price movements of a thing. The thing generally being a security, derivative, currency, or commodity. These financial charts can be used to develop your entrance and exit strategies, even if your more of a HoDLer than a daily trader.
The candlesticks have two ends. Each end represents either the opening or closing price of a commodity during an observation period – most charts will allow you to set the range for the candlesticks. Each candlestick typically represents one, two, four, or twelve hours. Longer-term traders might even choose to observe candlesticks that represent longer periods – like a day, week, or month.
How do candlestick charts allow us to make predictions about future price movements? One thing to keep in mind when asking this question is that groups are much more predictable than individuals. Prices of anything in any market are constantly in flux because of the behaviors of large groups.
When not enough people are trying to buy a thing at a certain price, owners of the thing who want to sell it begin listing the thing for sale at a lower price. The downward slope becomes slippery and selling prices become lower and lower until BAM – hordes of people are seeing these low prices as a great time to buy the thing that was once more valuable. More and more people buy it. Sellers begin raising the price of the thing. More and more eyeballs are watching and wanting the thing. Prices soar.
“Are we at the moon???” whales ask themselves before they sell the sh*t out of the thing they accumulated that is now so valuable. Suddenly, more of the thing is being sold than bought, and the whales ride their lambo down from the moon to collect berries once again from the Valley of the Dip.
People are emotional.
They purchase a cryptocurrency because they believe it will be worth more later, so they will in turn be worth more. When that belief is gone, people sell. Rises and dips are graphs of collective beliefs and emotional reactions. The speed at which these changes occur can be referred to as a thing’s volatility.
Crashes happen when huge groups of people feel fear. Mooning happens when huge groups of people are huffing Hopium.
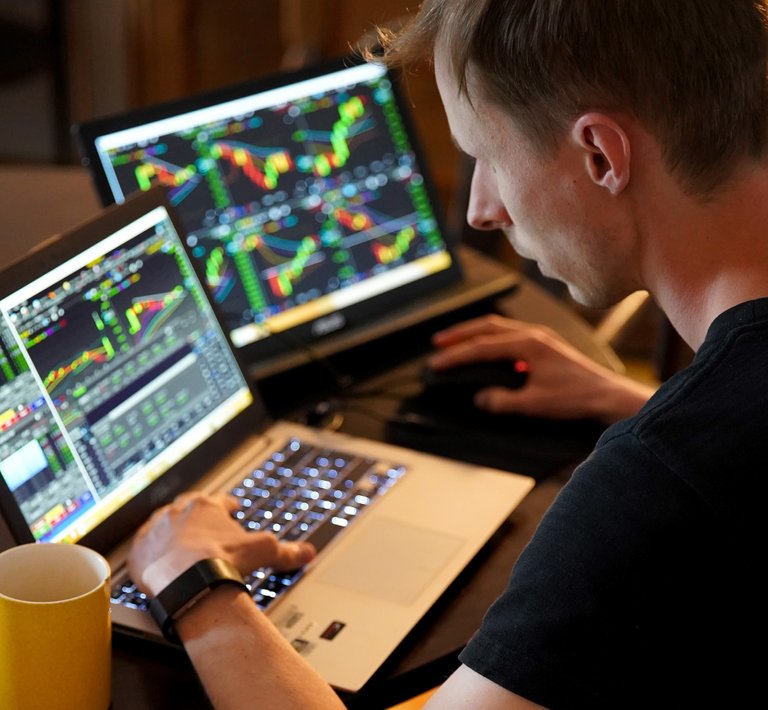
Cryptocurrency traders often take advantage of the high volatility of crypto markets by using intra-day charts, where the observation period being displayed by the candlestick is in minutes or hours. They may make many trades in a single day and are constantly watching candlestick charts, usually with added levels of analytical visualization tools overlaying them, on multiple screens whilst simultaneously wading through breaking industry news and rumors on dozens of discord servers.
This allows them to exploit the emotional mistakes of others to make gains. Buy from the fearful to sell to the believers. Every dollar made in trade, in a sense, is a dollar someone else lost. All you know about the tools available to inform your trading and investment decisions serves as competitive advantage against those who know less.
Of course, there will always be small groups of elite insiders- those at the top will collude to strengthen their ability to disproportionately manipulate the market- cornering the market on manipulating the movements of the masses so to speak. Regardless of this perpetual inevitability, there will always be windows for average people to win - and win big. Remember the GameStop short squeeze?
One of the keys is simply a dedication to economic literacy. This will bolster our luck- and luck is merely when preparation meets opportunity.
As Sun Tzu would say "Where there is chaos, there is opportunity." Lucky for us, we are surrounded by economic chaos where massive transfers of wealth occurring at an unprecedented rate.
Patterns emerge from decades of trading that has provided lots of data to help identify signals in candlestick charts and other visualization tools that can be used to help us make better financial decisions and survive the daunting economic jungles of our times. Each individual is perhaps more powerful than any of us could ever imagine at this peculiar period, perhaps more powerful than any individual ever has been in human history. Having 24 hour access to endless amounts of information and analytic tools that we can use to aid us in the establishment of generational wealth amid a global economic reset.
Think about wealth as energy. It is neither created nor destroyed. It cannot be defined by a numerical number but there is a finite amount of it flowing through civilization. We increase our wealth in order to increase our ability to manipulate our own civilization. Every action requires energy to maintain it.
What do you think about candlestick chart reading? Cryptocurrencies are a global market. The vast number of players causes rapid evolution. You can’t get too comfortable with any strategy or line of reasoning when it comes to investing your fiat into a blockchain ecosystem. What tools and ideas do you think are most important to inform your decisions in the ever-changing cryptocurrency space?
Special thanks to CryptoBum at Crypto Hide Out for helping me see money, markets, and charts in new ways
Posted Using LeoFinance Beta