Two days ago the hive woke up a little bit with a quite positive price rise and managed to reach almost 0.17$ and we thought that the bearish trend was changing, but unfortunately it didn't happen and we went back to the bearish channel touching 0.15$.
Today the trend is changing again and it is taking a big push to increase the price, with an increase in volume that goes from $100,000 to over $400,000 in binance, in reality it is not a lot of money that is moving, but it is an increase of 300% which is positive.
If we look at the graph carefully the price is in an expensive area at the moment, this means that it could fall at any moment.
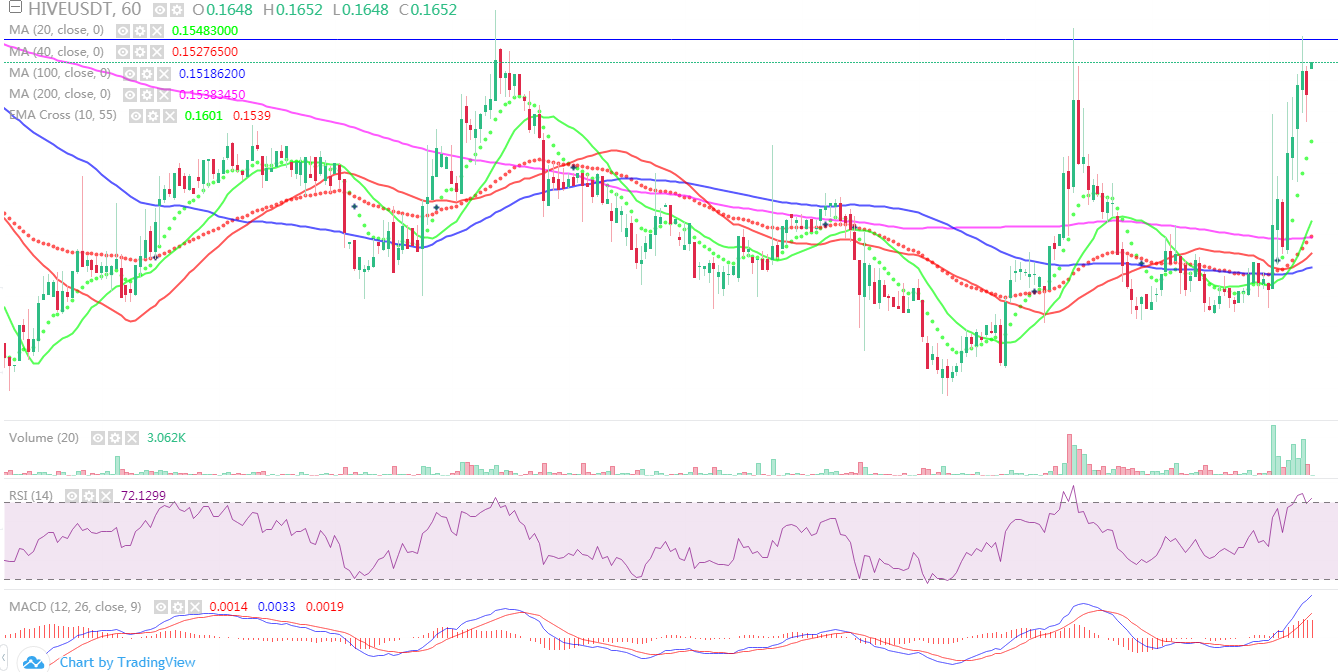
Its price is above the MA of 20, 40 and 100.
The RSI is above 70, which means that your price is also oversold.
As for the MACD we can also observe that the trend above zero is above and shows that the price is coming up.
These are the indicators that I usually use when trading any cryptomone currency, they are also very effective in the stock market.

The 1D time chart shows that we are coming out of the bearish channel, we should wait for the day to end and link that we don't enter that channel again, which would lead the hive to look for its April lows again.
Even though it is still at a very low price, I think it could fall, it all depends on the movements that the BTC parent makes.
However, it is still a good opportunity to buy in these ranges, because we know at the end of the year the bullfight will begin and we will never see the hive again at these prices.
Let's hope that the trend is positive for our hive, perhaps its increase today is due to the next HardFork.
This is not an investment advice, only my views about the hive, I am not responsible for losses on your investment.