Hola a todos!
Mercado: $BTC.
Marco temporal: Diario.
Algo importante en el estudio del trading son las divergencias. El gráfico que acá les muestro es ideal para hablarles sobre dicho tema.
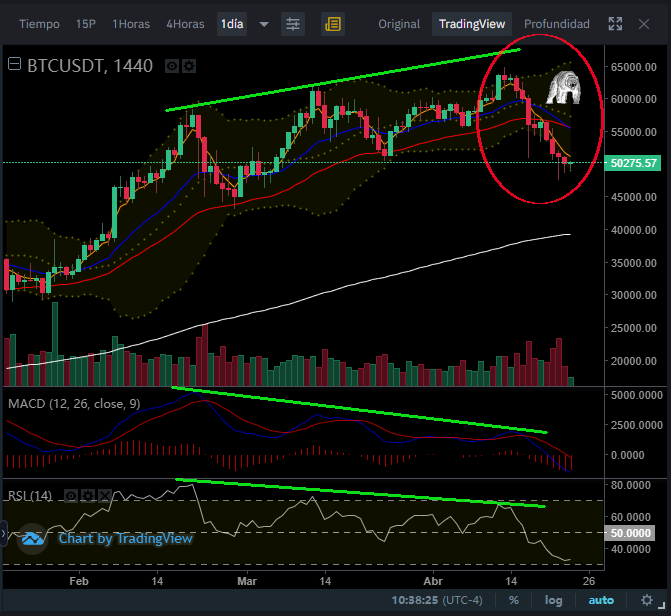
Si detallan la imagen verán 3 máximos (o picos) continuos posteriores a mediados de febrero. Al unir estos máximos se forma una recta con pendiente positiva. A simple vista la lógica nos indica que los precios del bitcoin estuvieron al alza durante ese período de tiempo.
En la parte inferior del gráfico se observan dos indicadores conocidos como MACD y RSI. Aplicando el mismo principio anteriormente explicado, para ambos indicadores obtenemos líneas rectas pero con pendientes negativas.
En un mercado alcista lo que esperamos es que las líneas formadas para los precios y para el MACD y RSI sean todas de pendiente positiva. Cuando esto no ocurre estamos en presencia de una divergencia negativa o bajista que nos alerta sobre una posible reversión de tendencia.
Cuando el bitcoin alcanzó los $64.854 perdió el impulso y la fuerza que traía y comenzó un retroceso que por ahora se proyecta a corto plazo con los bajistas al mando.
No sé cuantos se bajaron del bus BTC cuando rondaba los $60K, ni cuántos se montaron en los $48K, pero lo cierto del caso es que esta caída de bitcoin estaba anunciada con tiempo y de manera muy clara.
Nos vemos!!
Hello everybody!
Market: $BTC.
Time frame: Daily.
Something important in the study of trading are divergences. The graphic that I show you here is ideal to talk about this topic.
If you detail the image you will see 3 continuous highs (or peaks) after mid-February. Joining these maxima forms a line with a positive slope. At first glance, logic tells us that bitcoin prices were on the rise during that period of time.
At the bottom of the chart are two indicators known as MACD and RSI. Applying the same principle explained above, for both indicators we obtain straight lines with negative slopes.
In a bull market what we expect is that the lines formed for the prices and for the MACD and RSI are all positively sloping. When this does not happen, we are in the presence of a negative or bearish divergence that alerts us to a possible trend reversal.
When the bitcoin reached $64,854 it lost the momentum and the force that it brought and began a pullback that for now is projected in the short term with the bears in command.
I do not know how many got off the BTC bus when it was around $60K, or how many were mounted at $48K, but the truth of the matter is that this fall in bitcoin was announced in advance and very clearly.
See you!!
Posted Using LeoFinance Beta