The price of Bitcoin (BTC) plummeted by about $3,400 in one hour, warning traders that the correction in the parabolic trend is likely to be dramatic. Data from Glassnode shows that this drop resulted in the liquidation of a long position in Bitcoin futures worth approximately $190 million on Binance within one hour, the largest to date.
In a strong uptrend, the correction is rapid, but short-lived, because investors who expect the rebound to continue will use the downward trend to buy.
Catherine Coley, CEO of Binance USA, believes that by the end of this year, Bitcoin may climb to "$75,000 to $100,000." At the same time, investor Raoul Paul is more active. He expects that if the bull market trend continues, Bitcoin will reach anywhere between "400,000 and 1.2 million US dollars" in 2021.
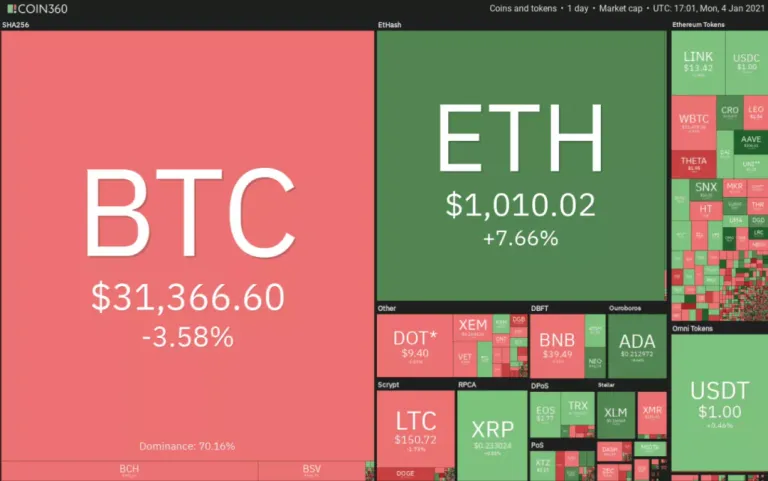
Daily performance of the crypto market, source: Coin360
The huge bullish forecast for the BTC price is largely due to the institutional adoption of Bitcoin. In a recent interview with the British Broadcasting Corporation (BBC), Galaxy Digital founder and CEO Mike Novogratz said: "As institutions enter, Bitcoin will be in short supply."
Although retail investors may have missed Bitcoin's rebound, they are retaliatingly buying altcoins that have soared to multi-year highs in the past few days. This brings Bitcoin's dominance to less than 69%.
But will the rise of Bitcoin and altcoins continue? Still need a few days of integration or correction time? Let's analyze the chart of the top ten cryptocurrencies to find out.
BTC / USD
Bitcoin's latest round of gains has pushed the Relative Strength Index (RSI) into the overbought zone, which indicates crazy buying by traders. Usually, after such a stage is a knockout game, and this is the case today.
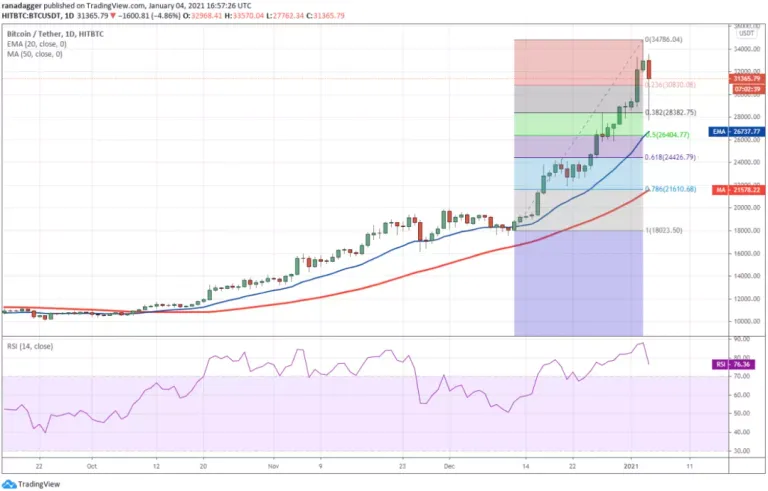
BTC/USDT daily chart, source: TradingView
The BTC/USD pair plummeted to an intraday low of $27,762.34, slightly below the 38.2% Fibonacci retracement level of $28,382.75. It can be seen from the long tail of the candlestick that day that this sharp decline was actively bought by the bulls.
If the bulls manage to maintain the price above the 20-day exponential moving average ($26,737), it indicates that the bulls are still optimistic and the bulls are buying on dips.
However, after today's large-scale trading day, the currency pair may enter a consolidation period of several days and then start the next trend. The currency pair may maintain fluctuations in the range between US$34,786.04 and US$26,000.
Contrary to this hypothesis, if the price falls below the 20-day moving average, it indicates that traders are eager to exit, which may pull the currency pair to the 50-day simple moving average of $21,578.
ETH / USD
On January 3, Ether (ETH) easily broke through the upper resistance of US$800 to US$840.93, indicating that the bulls are actively buying. The momentum continued today, with the largest altcoin reaching an intraday high of $1,156.456.
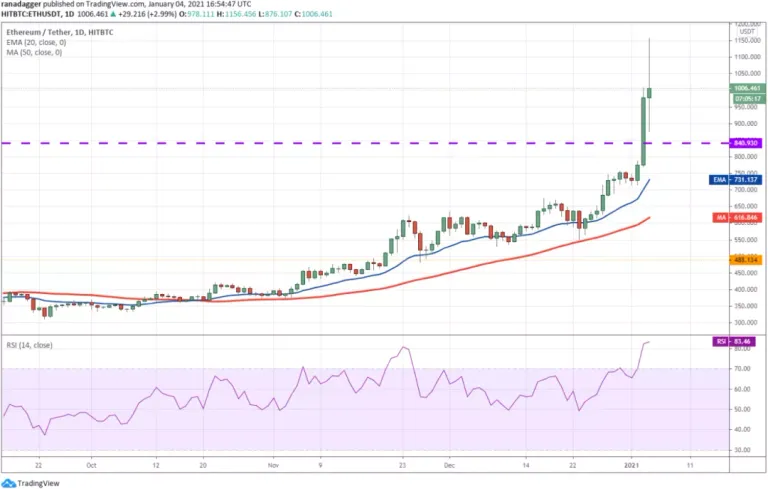
ETH/USDT daily chart, source: TradingView
If the bulls can maintain the price above $1,000, it will increase the prospect of a rebound to $1,260, and then to a record high of $1,420.
However, the long upper and lower shadows on the candlestick today indicate higher levels of profit reservations and lower levels of accumulation. After experiencing today's large-scale volatility, the ETH/USD pair may consolidate within a few days before starting the next trend.
If the price does not fall below $840.93, it indicates that the trader has not closed the position. In this case, the bulls may try to resume the uptrend. If the currency pair falls below the 20-day moving average ($731), this positive view will be invalidated.
XRP / USD
XRP is currently in a downward trend. After the sharp decline, if the price fails to rebound, it indicates that traders lack the urgency to buy. Consolidation near the support increases the risk of collapse.
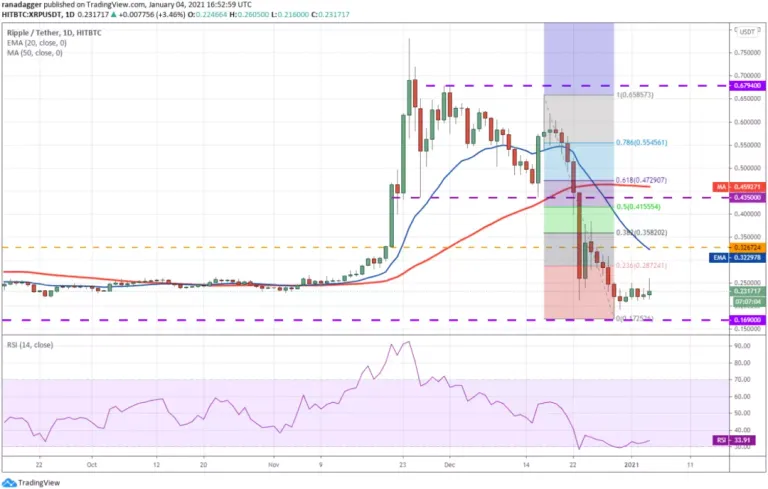
XRP/USDT daily chart, source: TradingView
The downward sloping 20-day EMA ($0.322) and the RSI near the overbought zone indicate that the path of least resistance is to the downside. If the bears drop the price below the support level of $0.169, the XRP/USD pair may continue to decline towards the next target of $0.10.
Contrary to this assumption, if the consolidation line breaks through and the currency pair rises above the 20-day moving average, it indicates that short selling has ended and a relief rebound may be in progress.
LTC / USD
Litecoin (LTC) rebounded from the support of $124.1278 on January 2 and resumed its upward trend. The altcoin soared above the first target of $160 and reached an intraday high of $173.3312 today, witnessing the profit reservation.

LTC/USDT daily chart, source: TradingView
However, on the positive side, the bulls actively bought the drop to $140, which shows that the market sentiment is still optimistic. The moving average is rising and the RSI is close to the overbought zone, indicating that the bulls are in control.
After today's wide-range trading day, volatility may shrink, and the LTC/USD pair may consolidate within a narrow range in the next few days. If the bulls can push the price above $173.3312, the currency pair may rebound to $184.7940. The first sign of weakness will be a break below the 20-day moving average ($122.96).
DOT / USD
Polkadot (DOT) resumed its uptrend after breaking through the upper resistance of 9.50 USD to 9.89 USD on January 3, but the rebounding market hit the barrier above 10.50 USD, and the price has reversed since then.

DOT/USDT daily chart, source: TradingView
If a trader buys a decline to the 38.2% Fibonacci retracement level at the $8.4507 level, it indicates that the level will strengthen. The bulls will then try to resume the uptrend. If they can push the price above $9.50, the card will be retested at $10.5169.
Conversely, if the bears drop the price below the $8.4507 support level, the correction may extend to the 50% retracement level of $7.8125. A break below this support level will indicate a weakening of momentum.
BCH / USD
On January 2, Bitcoin Cash (BCH) rebounded from the 20-day moving average ($340.94) and surged to the overhead resistance level of $370 on January 3. This opened the door for a rebound to the resistance level of $497 to $515.35.
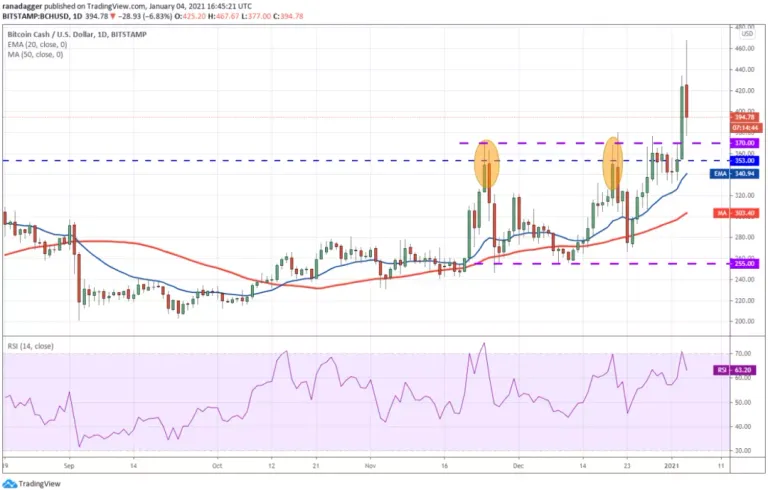
BCH/USD daily chart, source: TradingView
However, traders were actively booking profits at a high level today, which brought the price back to the breakthrough level of $370. The rising moving average and the RSI in the positive zone indicate that the bulls have an advantage. If the BCH/USD currency pair rebounds from this support level, the bulls may again try to push the price to $515.35.
If the bears sink and maintain the price below $353, this positive view will be invalid. Such a move indicates that the market has rejected higher levels, which may lead to range fluctuations.
ADA / USD
Cardano (ADA) rebounded from the 20-day moving average ($0.173) on January 2 and resumed its upward trend when it broke through $0.1966315 on January 3. Today, the altcoin surged to an intraday high of $0.2399022, but the bulls were unable to maintain a high level.
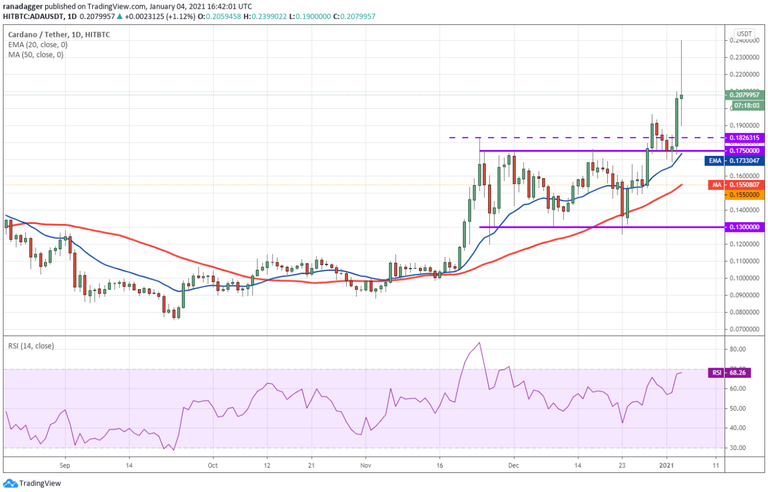 ADA/USDT daily chart, source: TradingView
Today's doji candlestick pattern shows the indecision of bulls and bears. When the shorts sell higher levels, the bulls continue to buy on dips. After today's large-scale trading day, as bulls and bears compete for supremacy, volatility may weaken in the next few days.
The rising moving average and the RSI near the overbought zone indicate that the bulls have an advantage. If the bulls can maintain the price above $0.21, the ADA/USD pair may resume rising.
A break below the 20-day moving average will be the first sign of weakness. If the support of the 50-day moving average ($0.155) breaks, the callback may deepen.
BNB / USD
Binance Coin (BNB) has fallen sharply from today's level of $43.2029, which indicates that profits are scheduled to be at a higher level. However, the rising moving average and positive regional RSI indicate that the trend is still rising.

BNB/USDT daily chart, source: TradingView
If the price rebounds from the 20-day moving average ($35), it indicates that traders continue to buy on dips. Then, the bulls will try to resume the uptrend and push the price to the target price of $50.
Contrary to this assumption, if the bears fall and maintain the price below the 20-day moving average, it indicates that the momentum is weakened and traders will not buy on dips. This may pull the price down to $32 and cause range fluctuations for several days.
LINK / USD
Chainlink (LINK) broke through the descending channel and the overhead resistance of $13.28 on January 3. This opened the door for a rebound to $16.39, and today the altcoin reached an intraday high of $15.644.
 LINK/USDT daily chart, source: TradingView
However, the long line on the candlestick today shows that traders are actively recording profits at higher levels, but the positive sign is that the LINK/USD currency pair has found buying support near the 20-day moving average ($12.36).
If the price stays above $13.28, the bulls will again try to push the price to $16.39 and then to $20.1111. Conversely, if the price falls below the moving average, the currency pair may fall to $11.29 and then to $10.
BSV / USD
The long wick on today's candlestick indicates that the bulls have failed to maintain the Bitcoin SV (BSV) above the overhead resistance of $181 because the bears are actively defending this level.

BSV/USD daily chart, source: TradingView
The price has now fallen below the moving average. If the shorts make the price fall below $160, BSV/USD may fall to the support level of $146. Conversely, if the price rebounds from current levels and rises above $175, the bulls will try again to push the currency pair above $181. If they succeed, they may rebound to $215.
However, the flat moving average and the RSI below the midpoint did not signal bulls or bears