This is 3th week after touching 100-week moving average on Bitcoin price chart. We have seen 3 weekly green candles after 4 weekly red candles. This is how 100-day moving average supported Bitcoin price.
Here you can see weekly chart of Bitcoin price. Bitcoin price went down fast after touching all time high. No other support lines supported Bitcoin price while dropping. 100-week moving average was solid and supported Bitcoin price chart. We should see Bitcoin price above 100-week moving average in next weeks. If not, we will see huge price drop on Bitcoin price chart.
I drew the similarity between 2022 and now. After breaking down 100-week movinga average, Bitcoin price went down 60%. It shows the importance of this support level.

Here you can see the indicators on weekly chart of Bitcoin price. RSI Indicator broke down bullish pattern. There was great bullish pattern coming from 2022 and It is broken down. We should see the new one.
Fisher Indicator reverrsed up from the bottom after 3 weekly green candles. MACD Indicator is trying to reverse up. It needs a few weeks to reverse up.
So, All of indicator can not show us bullish signals. We need to wait a few weeks to see the future.
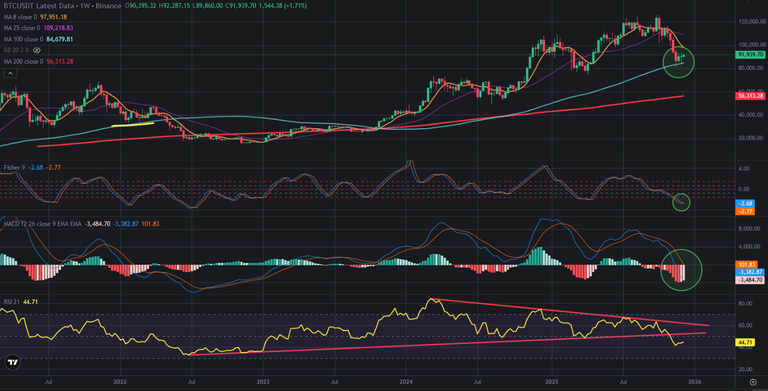
Even Bitcoin price got 2 weekly candle and started the new week with green candle, possible price correction on the table. If bad news drops on market, Bitcoin price may try to break down 100-week moving average.
You can see the importance of this average.
We will see..
Posted Using INLEO