We are at 8th week after 7 red weeks. We have not seen as long as these red weekly candles series on Hive price chart. The height of candles are decreasing. Hive price is trying to find the bottom level to reverse up.
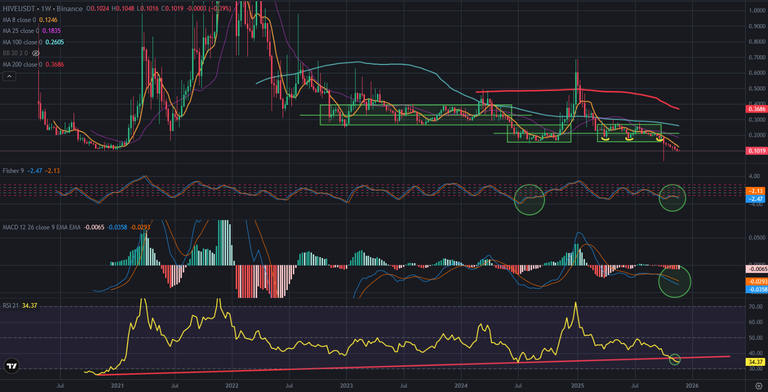
Here you can see weekly chart of Hive price. After 10th October market crash, Hive price broke down great triple bottom pattern. Lots of altcoins are going down the bottom level of 10th October. Hive price is above 100% level of the bottom of 10th October candle.
We should see the consolidation after these red weekly candles series.

Here you can see the indicators on weekly chart of Hive price. There was great support line on RSI Indicator and it is broken down. We should see the new uptrend pattern on this indicator. It is too early to see after completing big pattern. We need a few weeks to make good analysis.
MACD and Fisher Indicators are close to bottom and ready to reverse up. You can see what happened when they reversed up. Hive price entered consolidation peried for a few weeks and months. After completing this consolidation Hive price went up more than 200%. We may see same scenario but We need time to make a good pattern.
I believe that Hive price will enter bullish trend in 2026. It may be great time to pick up discounted Hive. I shared a few post about best time to build Hive accounts.
I am buying discounted Hive to power up.
Keep building..
Posted Using INLEO