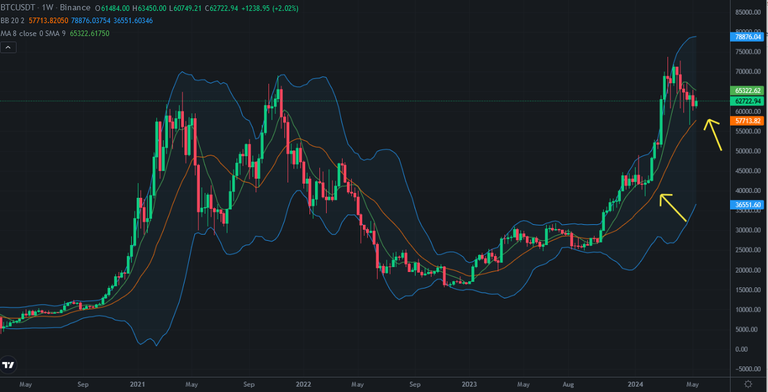
Bitcoin price is trying to touch the middle line of Bollinger Bands to be supported. It is great support for Bitcoin price for weekly chart. Here you can see weekly chart of Bitcoin and I drew how this line supported Bitcoin price before. Even Bitcoin price went down from 74K to 57K, It has not touched the middle line of Bollinger Bands.
So, Price correction below 57K is not on the table now. The middle line of Bollinger Bands is great support for Bitcoin price.
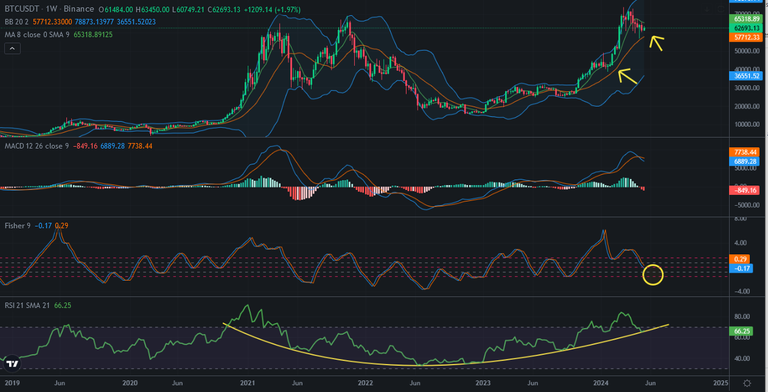
Here you can see the indicator of weekly chart of Bitcoin. There was a bowl pattern on weekly Bitcoin price chart. RSI Indicator is on the support line on weekly chart of Bitcoin. Fisher Indicator will try to reverse from the bottom. It means, we may see a few weeks for bearish. RSI Indicator may be supported by bowl pattern. If it happens, we may see huge dump at the end of 2024.
Even monthly chart of Bitcoin seems bearish, weekly chart Bitcoin began to seem bullish. Price correction on weekly chart of Bitcoin is close to end.
So, I can be good level to pick up Bitcoin above the middle line of Bollinger Bands for weekly chart.
We will see..
Posted Using InLeo Alpha