It was the biggest market crash in last week. It was special for crypto market. Crypto market deleted more than 100 Billion Dolar in a day. Even we have seen great market crash, Bitcoin price closed the week above 8-week moving average.
Here you can see weekly chart of Bitcoin price. 8-week moving average is important for midterm trend. Even we saw the biggest market crash, Bitcoin price is still above 8-week moving average. There is great Bowl pattern on Bitcoin price chart coming from 2021. It is so important for long term trend. There is no fear while being above this pattern.

Here you can see the indicators on weekly chart of Bitcoin price. There is great downtrend line on RSI Indicator. Bitcoin price is under pressure of this resistance.
MACD and RSI Indicators are trying to reverse up. It may be early to see these reversing ups. As I said, there is no fear on Bitcoin price chart while being above great bowl pattern.
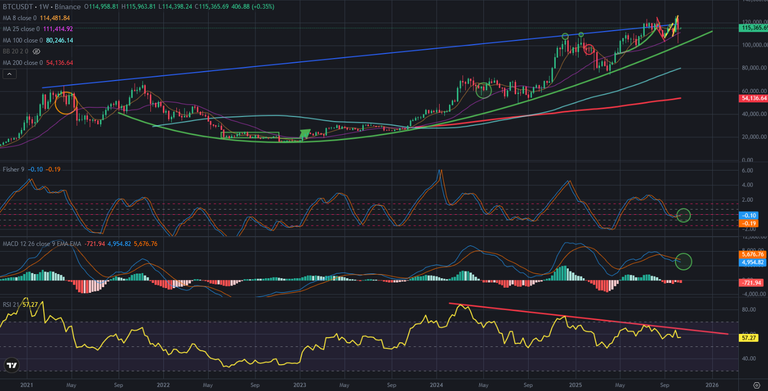
We will see parabolic price pumps on Bitcoin price chart after breaking up great downtrend line on RSI Indicator. Even we have seen the greatest market crash, I think we will see more all time high levels on Bitcoin price chart this year and next year..
We will see..
Posted Using INLEO