Heac and Shoulders pattern started to appear on Bitcoin price chart. It is bearish pattern. After touching all time high at 124K, Bitcoin price went down to draw head. After completing head, Bitcoin price will start to draw right shoulder.
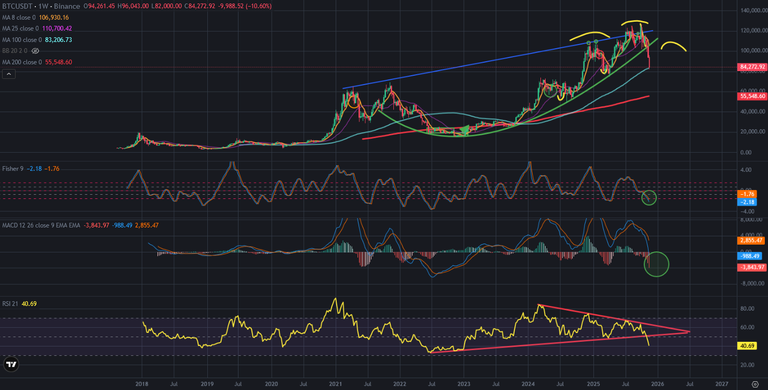
Here you can see weekly chart of Bitcoin price. 70K level is the base level of headn and shoulders. Today Bitcoin price touched 100-week moving average at 83K. It may not stop going down Bitcoin price. If Bitcoin price breaks down this moving average, We will see Bitcoin price at 70K USD. It will be the head pattern of Bitcoin price.

Here you can see the indicators of weekly chart of Bitcoin price. There was great support line on RSI Indicator. It is broken down. We should see the new pattern. MACD Indicators level is at bottom level we have ever seen. We hanve not seen as bearish as today. Weekly MACD Indicators level is at all time low. Fisher Indicator is close to the bottom and It may reverse up.
So, We may see reversing up on Bitcoin price chart. If we see, Bitcoin price may draw right shoulder.
Head and Shoulders pattern started to appear on Bitcoin price chart. It is bearish pattern after all time high. Price correction on Bitcoin price will continue.
We will see..
Posted Using INLEO
This is a very clear and well-explained technical breakdown. The Head and Shoulders pattern on the weekly chart is definitely a significant bearish signal that traders are watching closely, and the break of the RSI support is equally concerning.
However, this is where the dichotomy between a trader's and an investor's timeframe becomes critical. While the charts point to a potential test of $70K, it's happening against a fundamental backdrop of relentless institutional accumulation, as we just saw with the return of ETF inflows.
My question is: If price does wick down to that $70K 'head' level, do you see that as a capitulation event and a final flush-out before a reversal, given the overwhelming long-term bullish fundamentals (ETFs, adoption, halving cycle)?
Thanks for sharing this analysis—it's a crucial piece of the puzzle for assessing short-term risk, even for long-term holders.