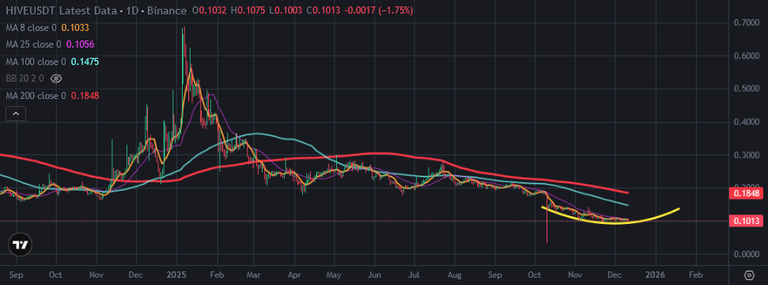
Hive price is in bowl pattern after 10th October market crash. It is going down but The downtrend force is decreasing. Hive price is close to the bottom of this bowl pattern.
Here you can see daily chart of Hive price. Hive price touchd this possible bowl pattern 4 times. Hive price is close to pass the half of this pattern. When it passes the half of this pattern, Hive price will start to go up. There are lots of signals that show us possible price pump on Hive price.
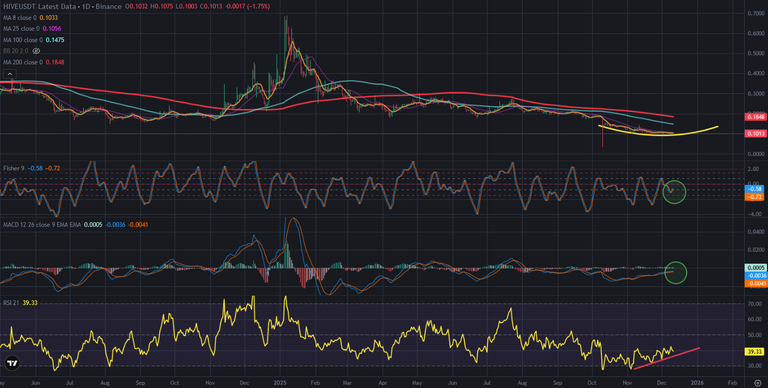
Here you can see the indicators on daily chart of Hive price. MACD Indicator is going up slowly. It should go above 0 level. We have seen bullish attacks when MACD Indicator is in this situation.
Fisher indicators is also trying to go up. Even price going down, Fisher Indicator is going up.
There is also great possitive divergence on RSI Indicator. The bottoms of RSI Indicator are increasing but the bottoms of price are decreasing. It is so possible to price pump after possitive divergence on RSI Indicator.
So, It may be good time and level topick up discounted Hive. If market reverses up, We may see huge potential on Hive price chart.
I listened a few astrological analysis and They said It may be possible to see bullish trend in crypto market after 20th December.
We will see..
Posted Using INLEO
Noticing the same signals here. Even though price is still drifting, the momentum indicators are quietly turning up. A confirmed break above the midpoint of this bowl pattern could trigger a nice move. Hive’s fundamentals remain strong—active community, real utility, and steady development. Accumulating quietly while the charts reset.
It can only become bullish of user would start to buy hive. We need more buyers, but we only have sellers. The authors here aren't interested in a long term investment. A lot take the earnings and move them to the exchanges.
Until that mentality does change, Hive will just follow the flow of the market.