We have seen another market crash on crypto market. Covid March 2020, May 19th 2021, Luna Crash, FTX Crash... We have not seen big market crash since Nov 2022. 0,09 USD was the historical bottom of Hive price. We have seen Hive price at 0,05 USD during market crash yesterday.
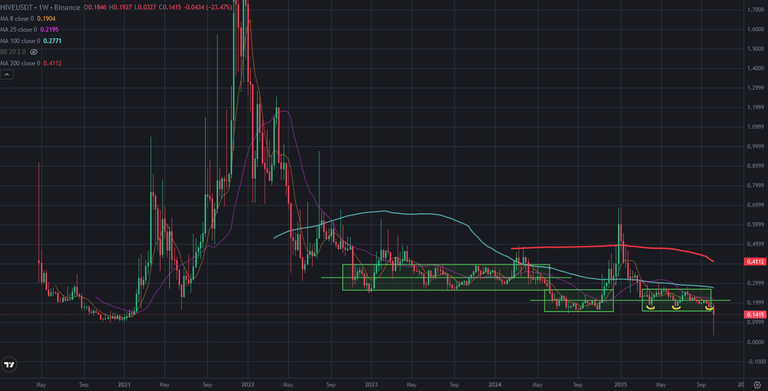
Here you can see weekly chart of all time Hive price chart. There was consolidation zone and depression zone on Hive price chart. I shared lots of analysis about Hive price chart and said I might be great level and time to pick up discounted Hive. There was also great triple bottom pattern but Market crash happened. Hive price broke down the bottom level of depression zone. While a few crypto touched 0 level, Hive price reversed up from 0,05 USD. It is very hard to see this scenario. It may be great level to pick up discounted Hive. Because Hive Blockchain marketcap is at 70M USD.
Even there is big market crash happened, the indicators on Hive price chart shows us that we may be close to the bottom. Here you can see Fisher Indicator. I circled the bottom and reversing ups before. You can see what happened after reversing up from the bottom.
MACD Indicator also may reverse up from this level. There is only negative screen on RSI Indicator. It broke down uptrend line a few weeks ago.
If Hive price closes the week above the bottom level of depression zone, We may see great reversing up on Hive price chart. All of long investors rekt. The game started today. We may see uptrend after these hard days.

I will cash into the market in next week. I will pick up discounted Hive. If We price goes down, I will cash into more liquid to buy.
We will see..
Posted Using INLEO