This the month of decision to continue bull run or reversing down on Bitcoin price chart. Bitcoin price is on the edge of the cliff in monthly chart. We will see the decision and prediction of long term trend on Bitcoin price chart at the end of this month.
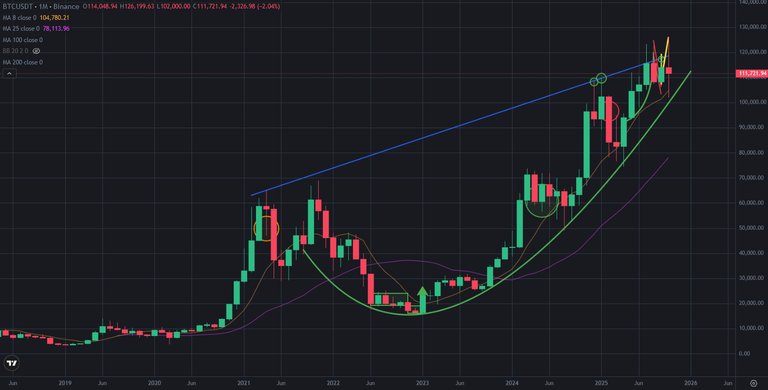
Heer you can see monthly chart of Bitcoin price. This is 10th month of the year and we are at 4th monthy red candle. We have seen 6 monthly green candles in this year. If we see more monthly red candles, Bitcoin price will enter bearish season. There is great bowl pattern coming from at the end of 2021, It will be broken down when Bitcoin price gets monhtly red candle.
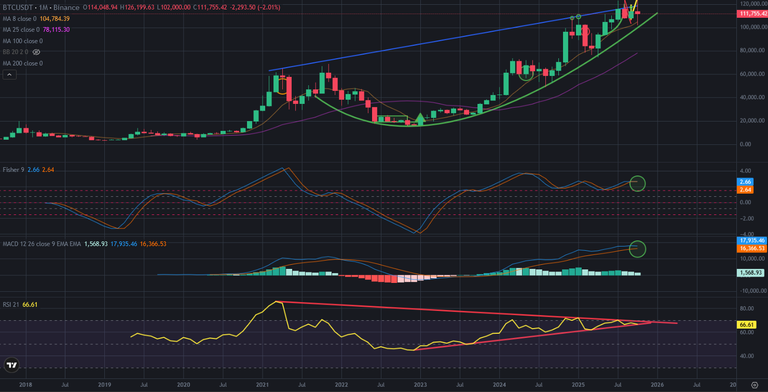
Here you can see the indicators on daily chart of Bitcoin price. That shows us what I try to explain. We are on the edge of the cliff. There is great down and uptrend lines on RSI Indicator. Bitcoin price stuck between these trend lines. If we see monhtly close below 111K in Bitcoin price chart, RSI Indicator will break down great support line.
If RSI Indicator breaks up downtrend line, we will see parabolic price pumps on Bitcoin price chart.
Fisher Indicator is on the top and It will reverse down when we see more monhtly red candles MACD Indicator is also at same situation.
If RSI Indicator breaks down great uptrend line, Great bowl pattern may be broken down. These are the triggers for each other.
So, we should follow monthly close on Bitcoin price chart. We may see big crash on Bitcoin price chart after breaking down these uptrend lines.
We will see..
Posted Using INLEO