
I included all the images from the initial post with the before and after from both the prices from Coinmarketcap and the charts with the lines drawn on them. This makes it easy to see how everything exactly played out.
 |  |
|---|
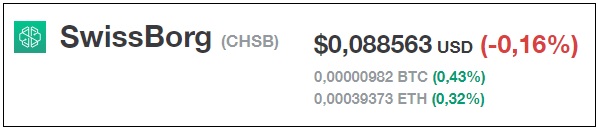
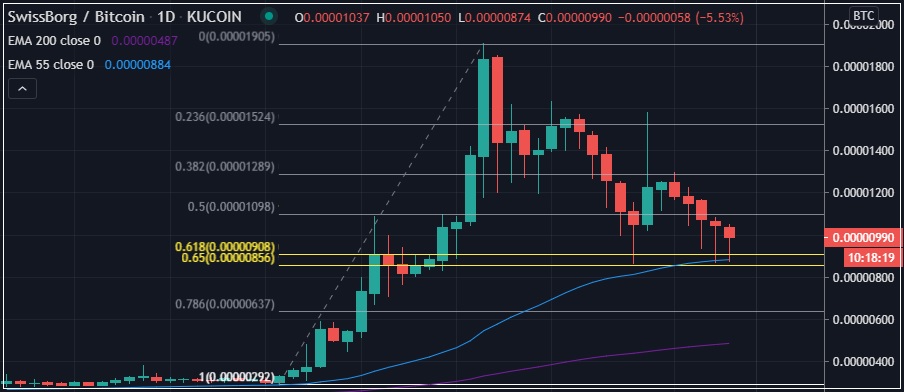
Swissborg Chart 05/07/2020
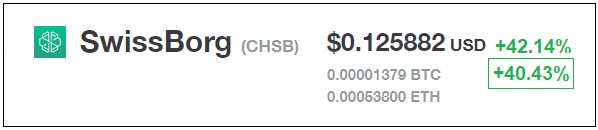
Swissborg Chart 19/07/2020
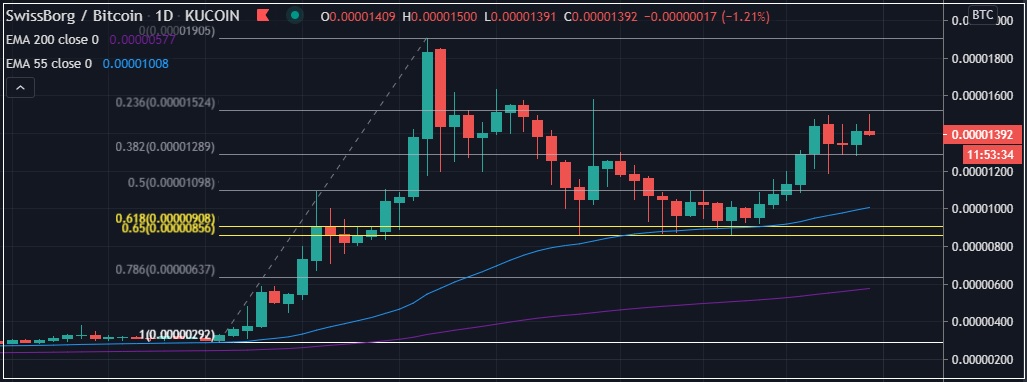
The Swissbrog Price perfectly held up to the 0.618 Fibonacci Retracement line along with the 55-day moving average testing those multiple times to shoot up in price afterward good for a +40% increase vs BTC! I did not trade this one as it's not available on Binance, but I did manage to earn 300 CHSB (37.76$) so far using their Community App which has been plenty of fun. For those that have not joined their promotional giveaway yet, I wrote an article on how you easily earn 25$+ within a week just by making a prediction on what the price of BTC will do the next 24h which literally takes 20 seconds. See Article Earn Free Crypto With Swissborg Community App! Using the promo code BSQKFFY to start off with 3000 Extra coins (3400 instead of 400)
 |  |
|---|
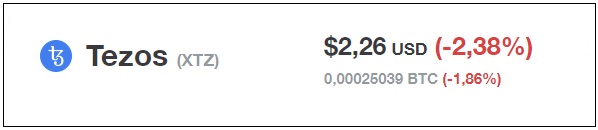
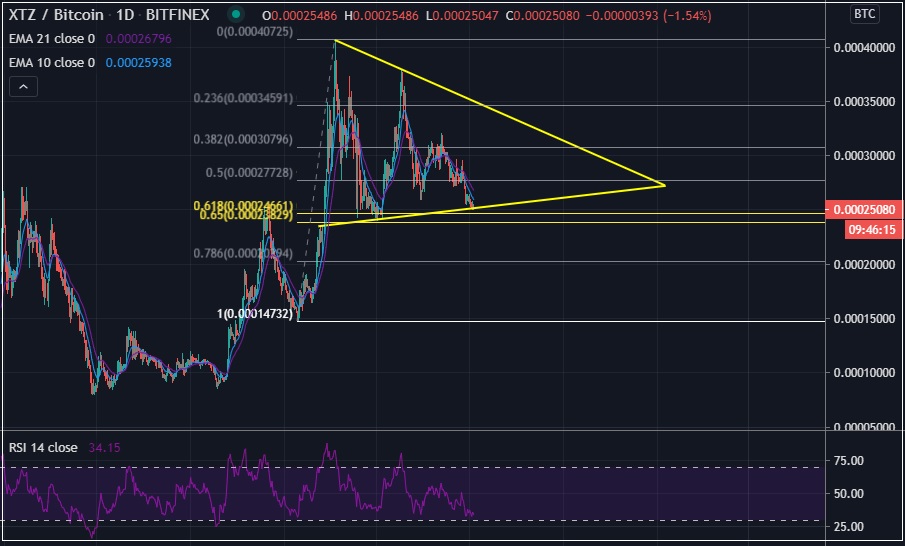
Tezos Chart 05/07/2020
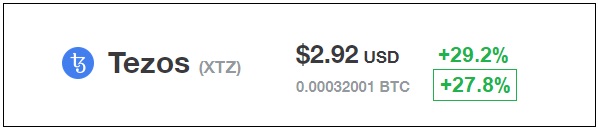
Tezos Chart 19/07/2020
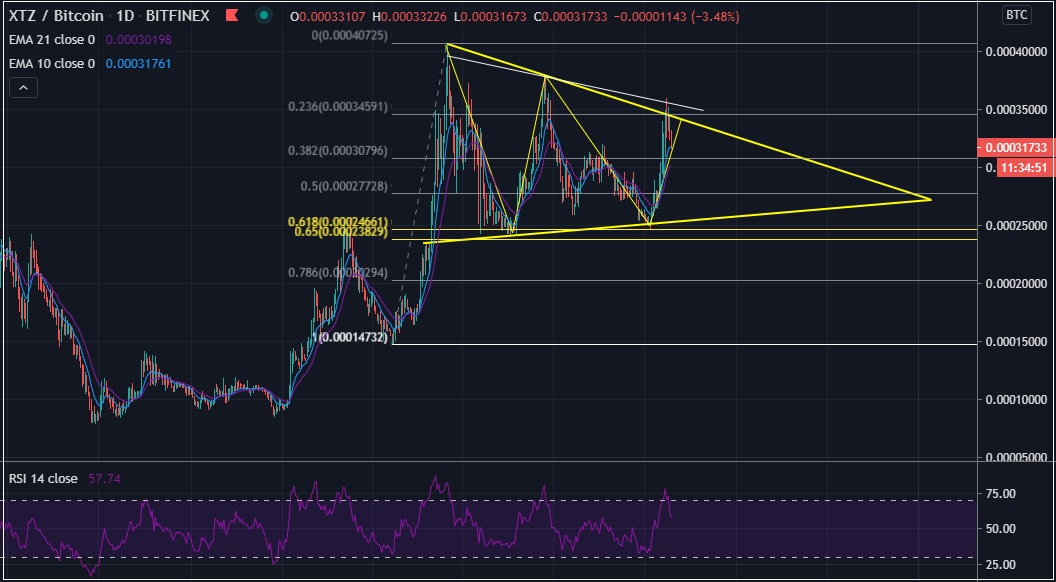
Tezos (XTZ) also perfectly found support on the 0.618 Fibonacci retracement line which formed the bottom support line in a symmetrical triangle. It pretty much ran up just above the resistance Line I did draw which made it good for a +38% trade in 10-11 days. Adter hitting the resistance zone, the price started to go down again. I did get some in on this one at Binance and have taken profit when it started hitting the yellow line on top of the symmetrical triangle. It almost looks loo easy when looking at the chart :-)
 |  |
|---|
Ontology Chart 05/07/2020

Ontology Chart 19/07/2020
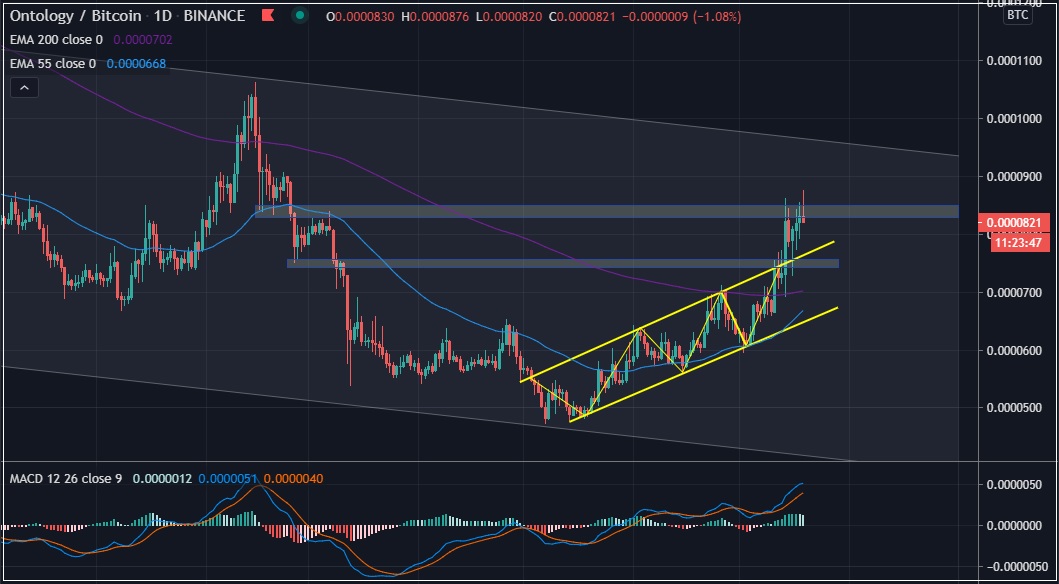
Ontology also perfectly followed the predicted trajectory going up around +16% in 9 days which is where I got out of the position. It did break out of the parallel upward channel to the next zone of resistance from previous highs/lows. The MACD also turned out to be a useful indicator on this one.
 |  |
|---|
Digibyte Chart 05/07/2020

Digibyte Chart 19/07/2020
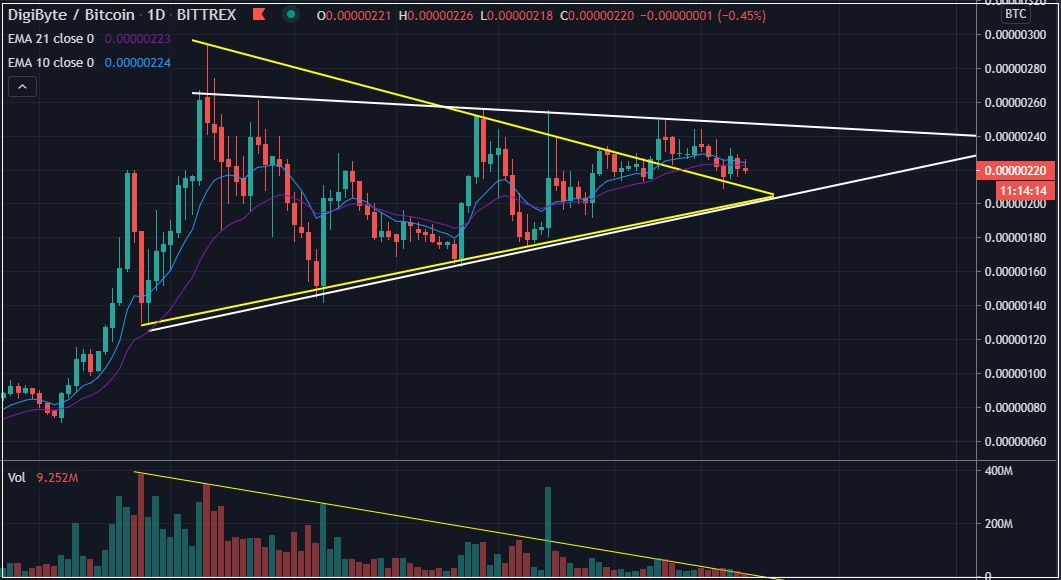
So Digibyte did manage to break out of the symmetrical triangle but there was no volume confirmation whatsoever and it found resistance forming an ascending triangle. I will keep a close eye on this one as it feels like it's bound to explode up (or down) once one of these lines get broken with some volume behind it. On the upside, it should be +40% before hitting the next resistance zone.
 |  |
|---|
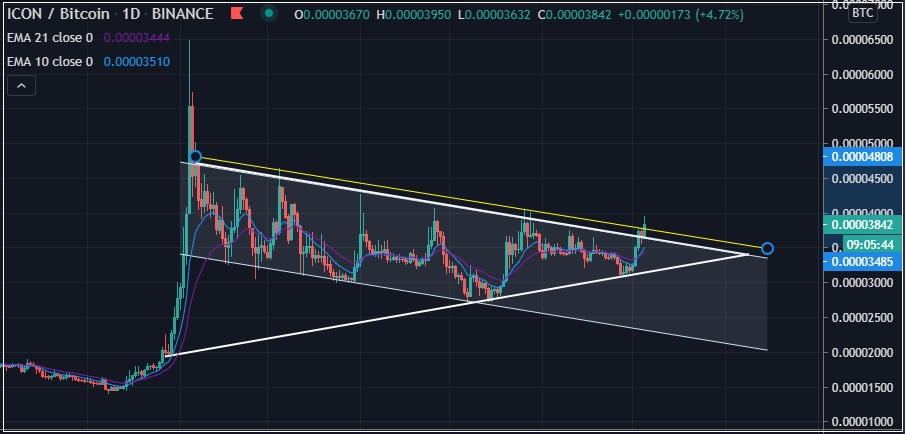
ICON Chart 05/07/2020
ICON Chart 19/07/2020
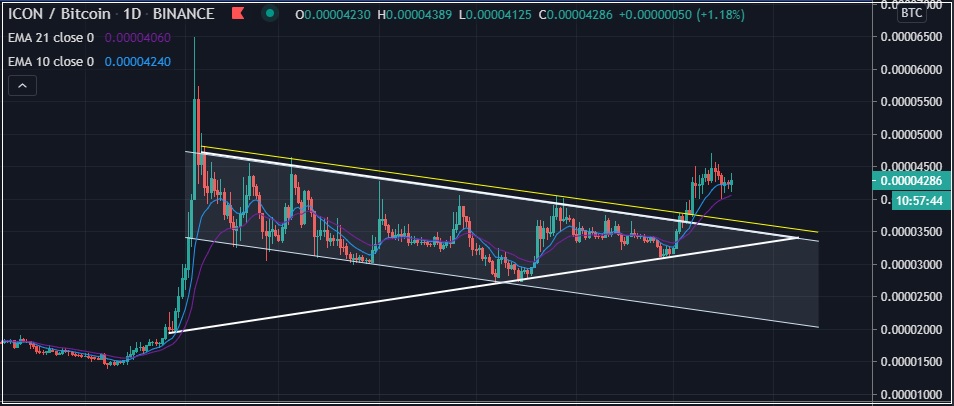
Icon did break out of the parallel upward moving channel always finding the 10-day and 21-day moving averages as support on the way up. I did not trade this one but added to my long term ICON hold locking it up in crypto.com Earn which pays +8% yearly Passive Returns on ICX. To see how to get more passive returns on your crypto, make sure to check my monthly Passive Crypto Earnings Report
 |  |
|---|
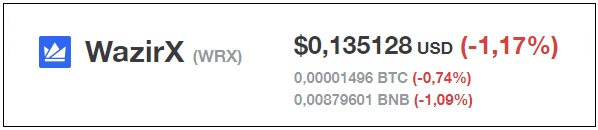
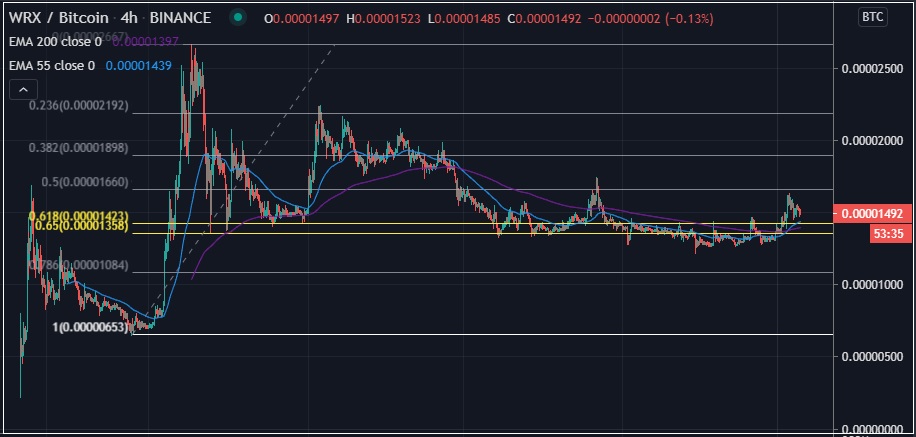
WRX Chart 05/07/2020
WRX Chart 19/07/2020
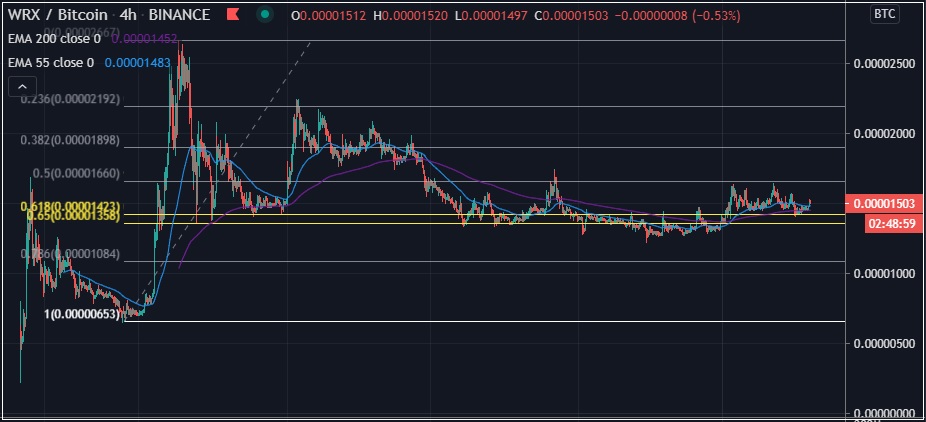
WazirX pretty much continued to range just above the 0.618 Fibonacci retracement line. The 55 moving average is still holding up above the 200 moving average on the 4-hour chart which should be a more bullish indication. I haven't gotten into this one mostly because it's a lower cap coin but I continue to keep an eye out on it.
All the above setups were based on fairly basic Technical analysis principles that I learned and summarized in bite-sized pieces that are very easy to understand. All these lessons I learned can be found at the links below...
Technical Analysis #01 | Basics
Technical Analysis #02 | Trends
Technical Analysis #03 | Bearish Patterns
Technical Analysis #04 | Bullish Patterns
Technical Analysis #05 | Symmetrical Triangles
Technical Analysis #06 | Volume Indicator
Technical Analysis #07 | Moving Averages
Technical Analysis #08 | MACD
Technical Analysis #09 | RSI
Technical Analysis #10 | Fibonacci Retracements
Technical Analysis #11 | Candlestick Patterns
Free Software I use for Charts Tradingview | The Platform I use for Trading Binance |
|---|
 |
 |
Posted Using LeoFinance