Foreword: this material is my private trading idea, published on August 14, 2022 on the tradingview service. original text in Russian, translation below. Link to the original trade idea.
Oooh, this is an interesting story, how to bend the market)) but I haven’t seen similar figures below, no one said that DOT at the peak of the market is 10,000% for early investors, but there were a lot of talks that DOT at 100-1000 dollars apiece 🤣 Looking ahead, there was a denomination of x100 tokens, just before the listing on Binance, which means that the number of all tokens was multiplied by 100, and their price was divided by 100. Well, who in 2022 will look for this information, given that the DOT price charts against the dollar cleaned everywhere🤦🏻♂️
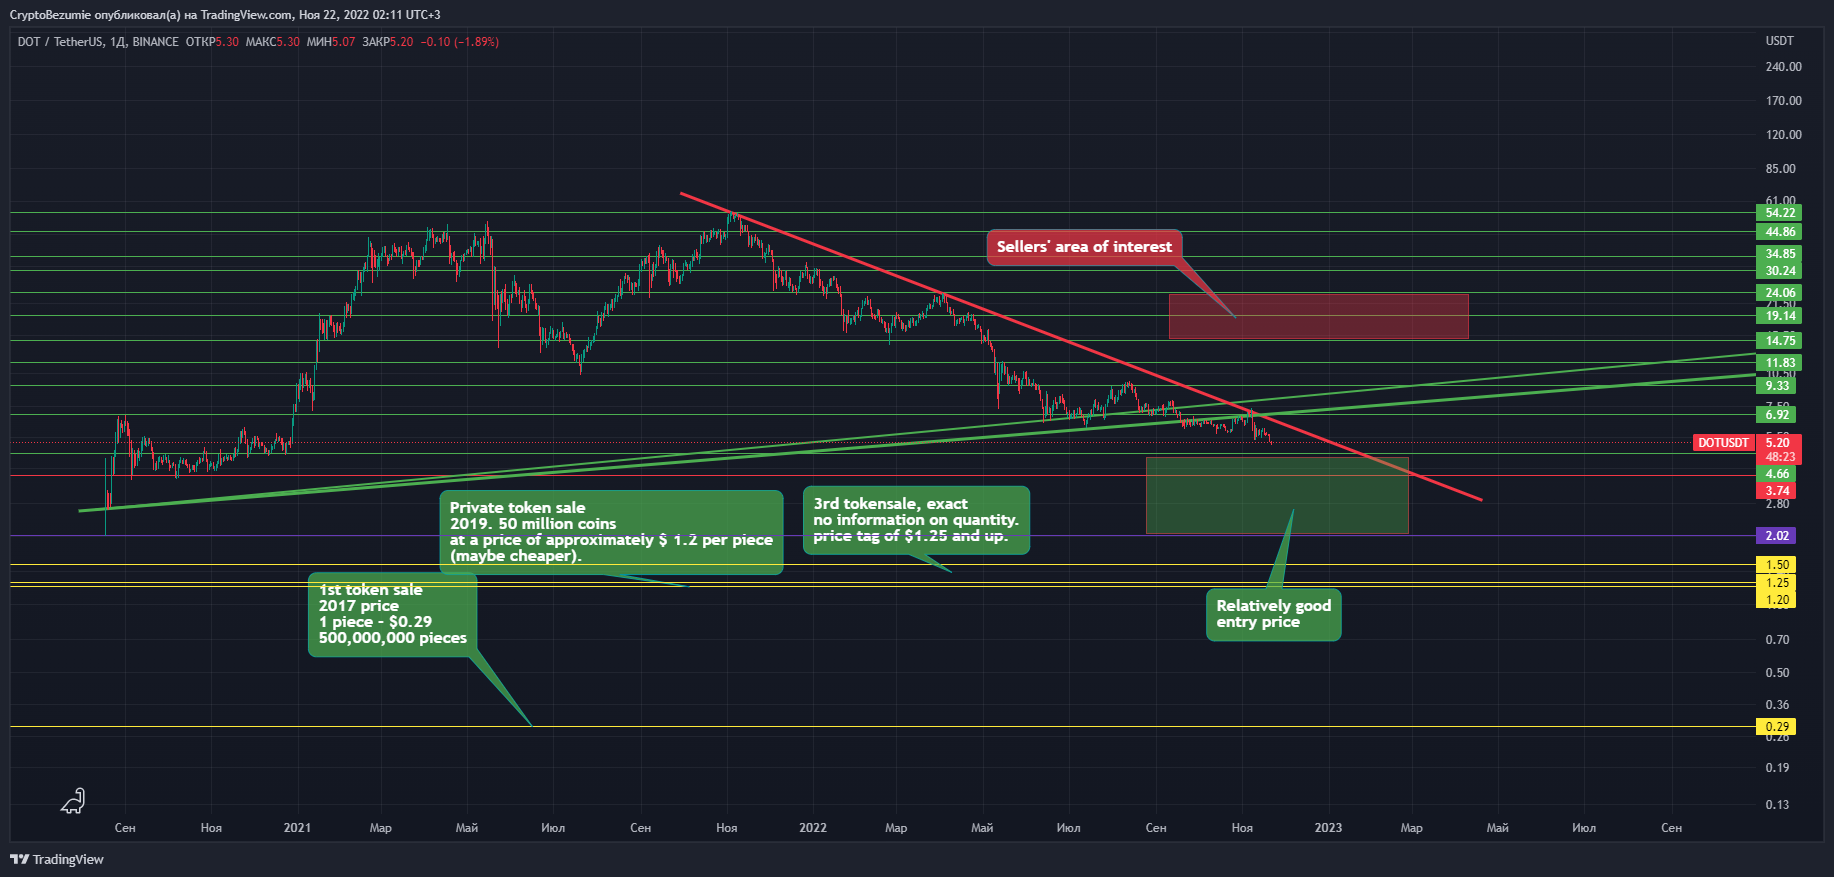
The first token sale of DOT tokens is a total supply of 5 million units, but after the x100 denomination (the price is divided by 100 and the number of tokens is multiplied by 100), we have a total realized supply at that time of 500,000,000 units, which is slightly less than half of the total current supply!! ! The price of the first token sale according to the data from the forklog website is $0.29 (proof 1 ), (proof 2 ).
Another non-public token sale in 2019. The exact price is not known, but there are some initial data on the basis of which an approximate price can be calculated. The declared amount that they wanted to raise was about $60 million (proof). At that time, 500,000 pieces of coins were sold (proof), multiply by the denomination coefficient 100, we get 50,000,000 pieces. At the current exchange rate, taking into account the denomination, the price tag then comes out - $ 1.2 per piece.
The next token sale in 2020, prices started from $1.25 and more, more accurate information could not be found. It is logical to assume that they planned to collect several tens of millions of dollars, respectively, by logic we make independent conclusions on the number of tokens sold at the auction.
Now attention! - Total circulating supply - 1,140,000,000 pieces. Of these, more than 50% were sold on tokensales at prices of 0.29 (the bulk of 500 million) and 1.2 - 1.5$, about 100-200 million pieces, approximately 600-700 million out of 1.2 billion, at prices of $0.5. At the moment (August 2022), early investors are on a profit of 1700-2000%, at market peaks this is more than 10,000% profit, and at the average distribution price it is about 4000-5000%.
I haven’t seen these figures anywhere, and the price chart before the denomination can only be found on the site https://messari.io/asset/polkadot/chart/price in all other services, the history has been cleared, and the history of the DOT vs. dollar chart begins after listing on Binance 😉
The volumes at the peaks of the market in 2021-2022 are also outstanding, with great pleasure the coin was pushed on both cheeks to new holders of the "promising" coin.
Distributing 600-700 million tokens is an extraordinary task, so we take this into account when working with the chart.
Let's miss the fact that "bunkers" are blocked at parachen auctions, etc. this is a beautiful legend for fans, but blocking all coins, as you can understand from the above, does not make sense when there is such a profit from their sale. It can be assumed that investors have already pulled out their invested funds and earned well, the rest of the unallocated coins are their passive income from staking, but this does not make it easier for us when we can still sell and sell. Even if the price goes below $1, they will still sell in plus...
If you work with this tool, then carefully, based on the above facts. Not a significant amount of the deposit or with stops.
On the positive side, there was an 88% correction from the peak. It is impossible to distribute the entire volume collected on the token sale in 1-2 years, a very large offer, and accordingly there is no interest in rolling the price to 0, it is also a new technology that is being tested. It is likely that there will still be pumps and waves, now there is already a 55% growth wave from the local minimum.
I put a green rectangle on the chart, this is the zone of a long previous trade. If the market is positive, if it breaks out and consolidates above the downtrend (red), this is the target. To make a profit, it is desirable to exit earlier than the others, since everyone sees these zones.
In a negative scenario, a good zone for buying is the level of $2-4 per piece. As for $2, it is unlikely, but to see $3.7-4.5, as for me, there is a chance, not tomorrow and not in a week, but this is a good entry price if the crypto market does not come to a total ..., well, you understand.
Can they swing up to $100? - Of course they can, Solana is a very good example, but it will have to be well spent, depending on the sentiment of the market, at the moment there are not even prerequisites for such a movement.
Only 3 months have passed, this is not such a long time, if you look from the side of the observer, not the participant =)
The price went down from $9 to $5. Depending on the general sentiment of the market, there may be dips and sharp movements where you can already consider buying.
This is not financial advice, but food for thought. do your own analytics and good luck.
Posted Using LeoFinance Beta