The Avalanche chain has an interesting design, with three chains running in parallel. The c-chain, x-chain, and p-chain. In a nutshell the c-chain is used for contracts, the x-chain for transactions and the p-chain for staking and validators. More info about the design in the whitepaper.
Most of the users are using the c-chain that is Ethereum compatible and can be accessed via metamask. All the defi apps but on Avalanche.
How is Avalanche doing these days? One of the latest crypto trends with the SocialFi apps has made its way to the Avalanche chain with the Stars Arena app. In the last month it gained some tractions, but then had some issues and its future is now uncertain. Let’s take a look at the data.

Let’s take a look at the data on the Avalanche network and see what has been happening in the last period.
The data presented here is mainly from https://snowtrace.io/.
We will be looking at:
- Number of Addresses
- Active Addresses
- Daily Transactions
- Fees
- Contracts
Number of Addresses
One of the key metrics for crypto projects is the number of wallets.
First the overall number of wallets.
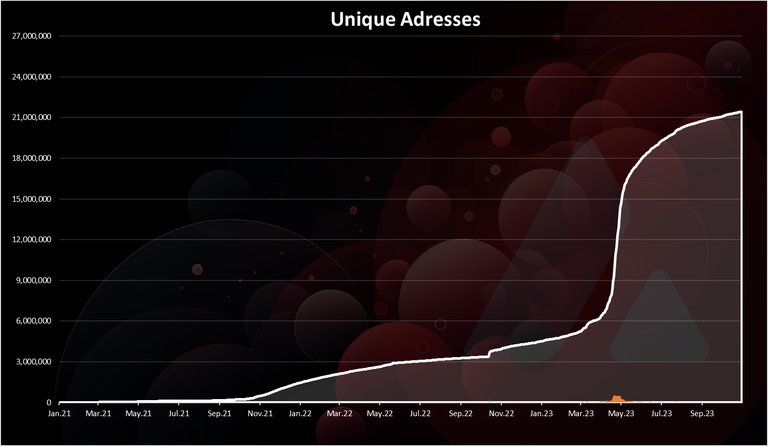
This is quite unusual chart. The growth in the number of wallets has been in 2023 that has been a year when the crypto industry is in the bear. There is a growth back in 2021 during the bull market, but those numbers are way smaller from what has happened in 2023. The year started with 4M addresses and we are now at 21M. For comaprission Ethereum has around 250M wallets.
If we take a look at the new daily wallets we get this.
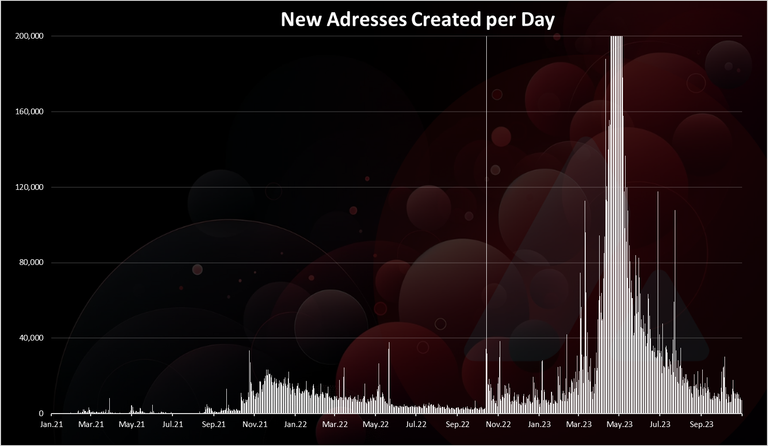
We can clearly see the spike in the new wallets created in April 2023 when for a while there were more than 500k wallets created per day. Not sure what caused this spike, but the Starsarena app came later in September, so it is not because of it. Maybe it was some bots doing this.
Back in October 2021 there was another spike during the bull market, but that one was much smaller with around 20k wallets created per day.
Active Addresses
How many of the wallets created are active? Here is the chart.
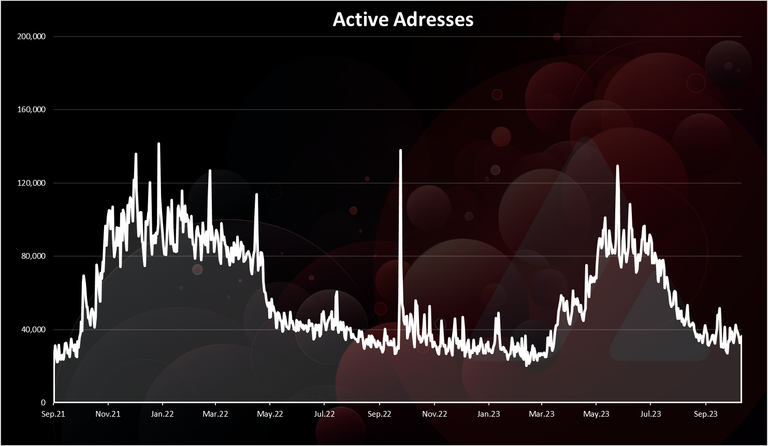
The numbers of active wallets increased at the end of 2021, from bellow 30k up to 100k active wallets in the beginning of 2022. Then a drop in 2022 down to 40k active wallets, and an increase again in the summer of 2023 with the numbers of active wallets reaching again a 100k for a short period of time. In the last days they are again around the 40k mark.
For reference the number of active wallets on ETH is around 500k.
Daily Transactions
The activity on the network is mostly represented by the number of daily transactions.
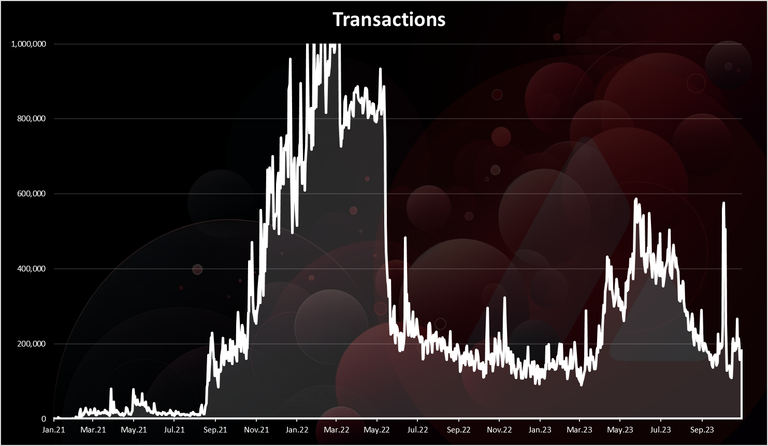
On the transactions side we can see a massive increase in the number of transactions at the end of 2021 up to 1M transactions per day, and then a sharp decline in May 2022 down to 150k transactions per day. A growth again in the summer of 2023 up to 600k transactions and a pull back to 200k. We can see a short lived spike in the transactions in the beginning of October, that might be corelated with Stars Arena.
On Ethereum the number of transactions per day is around the 1M mark.
Fees
Avalanche has low fees but not as low as Solana or Polygon. It is in the category with the BNB chain with fees going from $0.1 to $0.5, depending on the market conditions and operations being made.
Here is the chart.
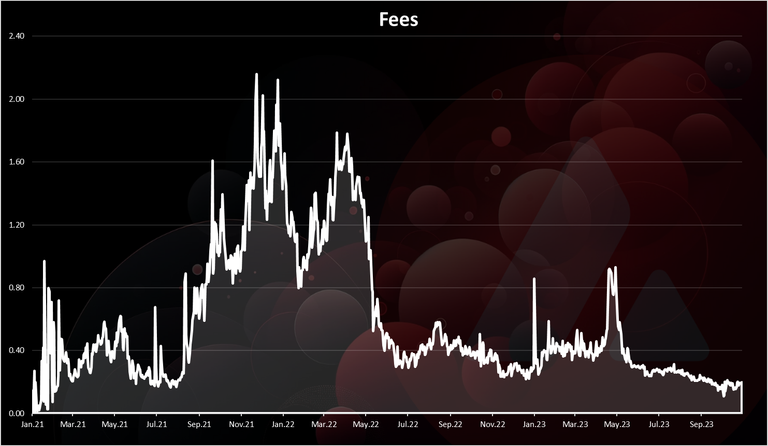
The above are the fees per transactions in $.
The highest fees were recorded in the beginning of 2022 with ATH of $2. The fees dropped later in 2022 to around $0.4 level, and have been going down since then, with a spike back in May 2023 and a drop since then to around 0.1 where we are now.
Contracts
Avalanche as Ethereum is a smart contract platform so here is the chart for verified contracts per day.
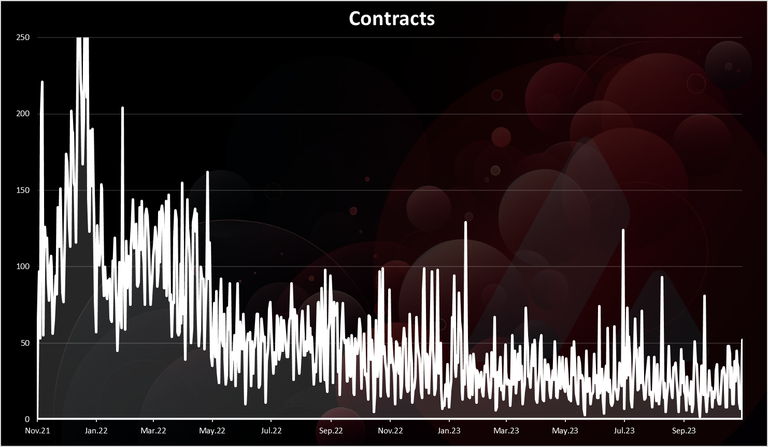
A higher numbers in 2021 and a drop since then. From 250 to 25 daily contracts created these days. The numbers of contracts has been quite steady in the last year.
Price
At the end the chart for the price.
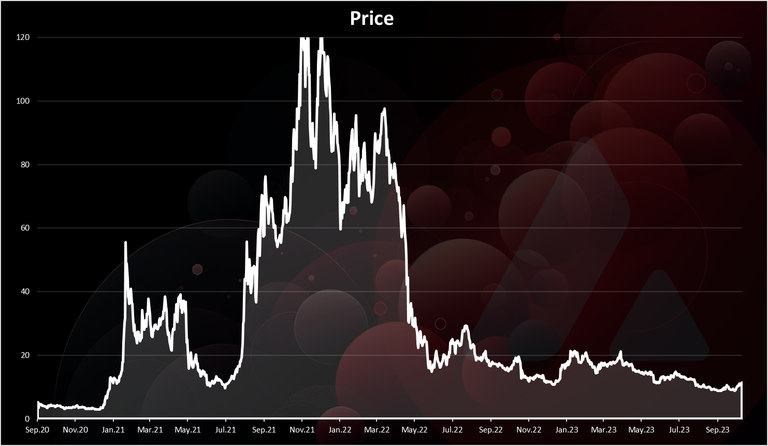
A massive run up for Avalanche back in 2021 from $3 up to $120, but a big drop as well in 2022 to around $20. A slow decline since then with some ups and downs, to around $10 where we are now. Will Avalanche manage to gain some tractions again time will tell. It is competing with the top smart contract platforms where the competition is hard and growing by the day.
All the best
@dalz
Good to knowing about this crypto and its movement
This post has been manually curated by @steemflow from Indiaunited community. Join us on our Discord Server.
Do you know that you can earn a passive income by delegating to @indiaunited. We share more than 100 % of the curation rewards with the delegators in the form of IUC tokens. HP delegators and IUC token holders also get upto 20% additional vote weight.
Here are some handy links for delegations: 100HP, 250HP, 500HP, 1000HP.
100% of the rewards from this comment goes to the curator for their manual curation efforts. Please encourage the curator @steemflow by upvoting this comment and support the community by voting the posts made by @indiaunited.
It's interesting to see how the network has grown in terms of number of addresses and daily transactions, even during the bear market.
Avalanche back is dumping and pumping.
Let's see how it will go by the end of the pump
I was not aware of that. Thanks for sharing this.
This is great to see the performance of the Crypto space
During the last bull market we saw that there was a lot of interest in this project which caused the price to go up a lot and now we see that it has less active users but Not a problem as we are now seeing the markets going up so the new user will come on top of that. Thanks for sharing this great analysis.