With the last upgrade called EIP1559 (London HF), one of the things that the Ethereum changed is the way fees are paid. Before all the fees that users pay were just going to miners. After the EIP1559, there is a so-called base fee that miners get, but everything above that is being burned.
Let’s take a look at the data in the first months.
Here we will be looking at:
- Overall Ethereum Supply
- Ethereum Created Per Day
- Ethereum Created Per Day After The London HF
- Ethereum Burned Per Day After The London HF
- Share Of The ETH Burned From The Total Inflation
- Monthly and Yearly ETH Inflation
For the supply we will be looking for the overall existence of the Ethereum network and then we will take a closer look in the last week, after the EIP, August 5, 2021 till August 12, 2021.
Overall Ethereum Supply
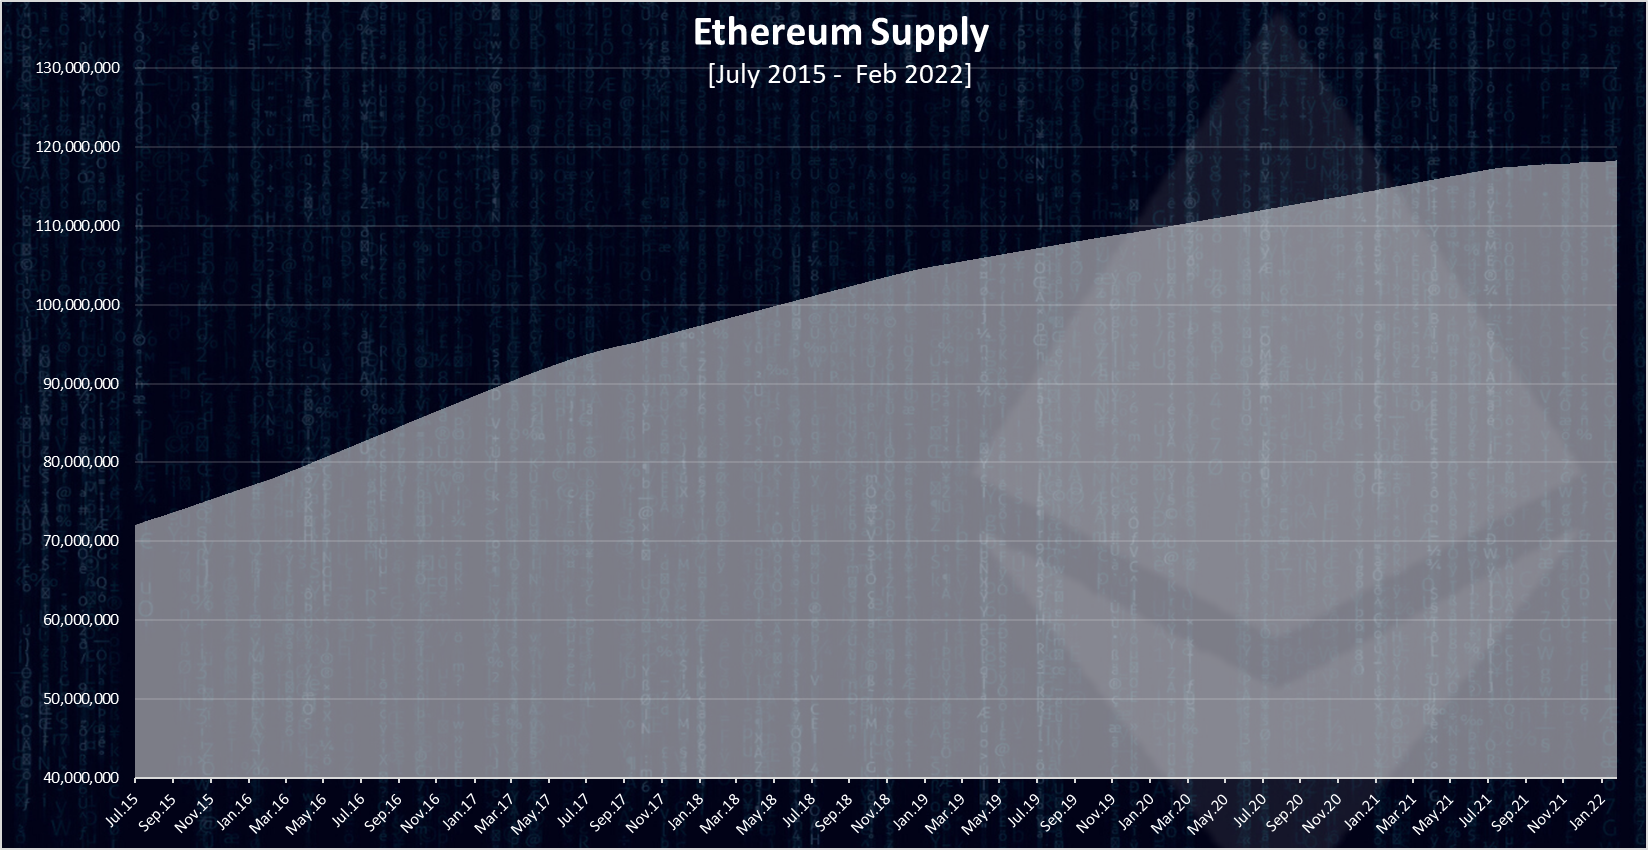
The supply is always an interesting topic in crypto. At the moment of writing this, the Ethereum has a total supply of 118.2M coins.
Ethereum had a presale in 2014, where 60M ETH ware sold to investors and 12M ETH was allocated to a development fund. A total of 72M starting supply. Since then, an additional 47M ETH were mined and added to the supply. The initial supply still represents more than 60% of the current supply.
Here is the chart for the ETH supply over time.
source
As mentioned around 47M ETH in total were mined since its inception. We can see that the supply has been growing, but in the last period a slow down trend has started to emerge.
This is caused because of the ETH burns.
Lets look closer.
Ethereum Created Per Day
The chart for the daily inflation looks like this.
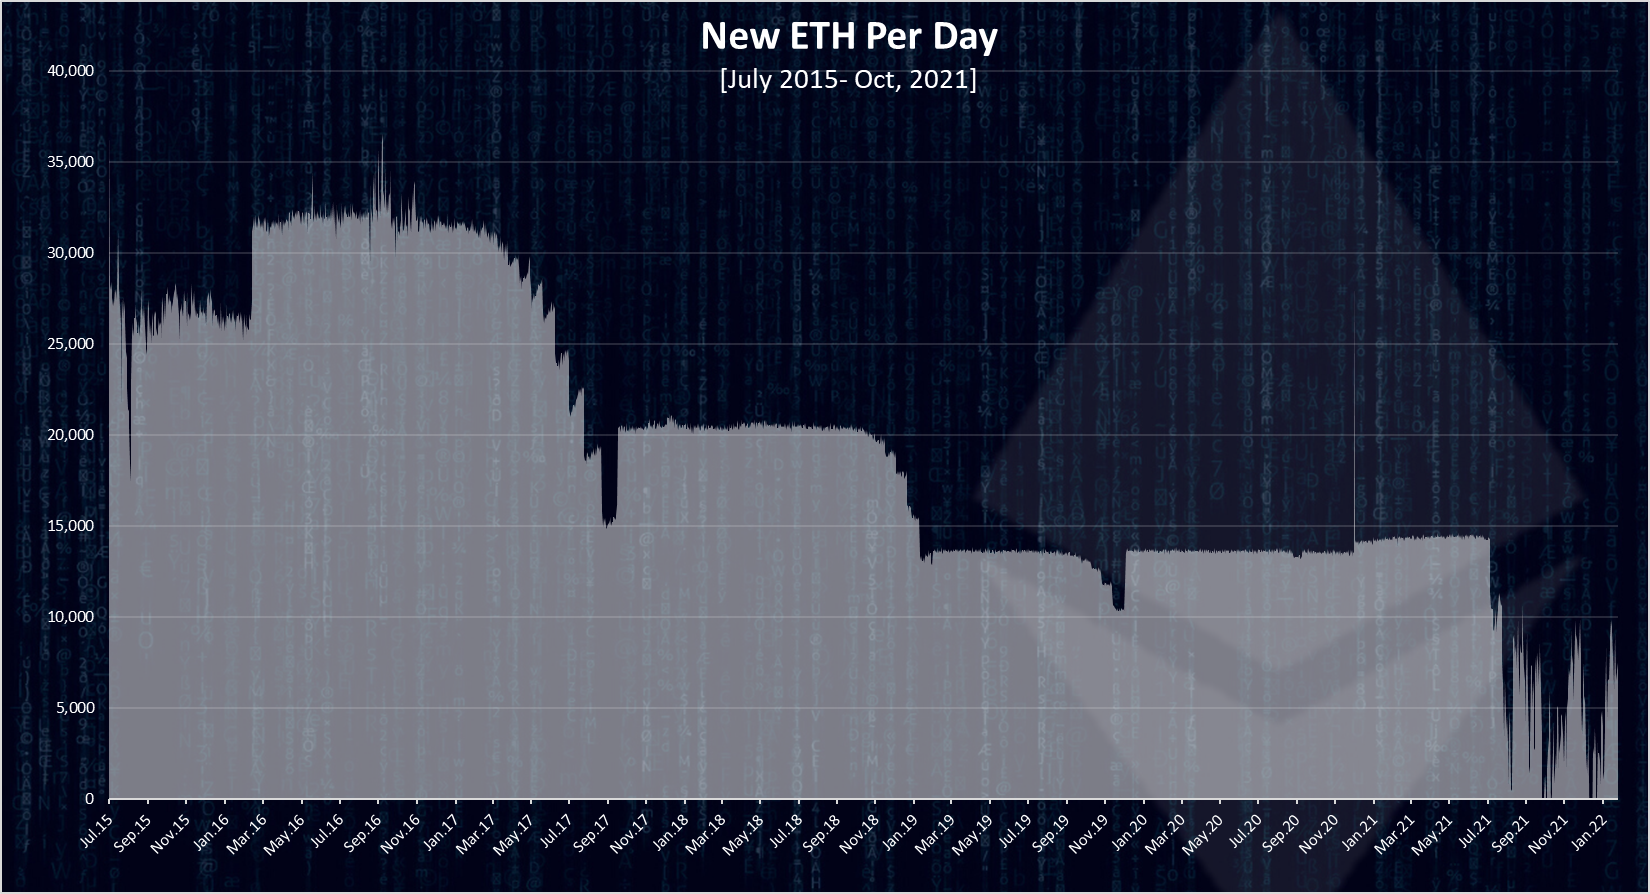
We can see that at first the inflation was higher with more than 30k ETH generated per day. It has dropped since then and before the London HF in August 2021 it was around 13.5k ETH daily. Since August we can notice the shar drop in ETH daily inflation with spikes in between.
Ethereum Created And Burned Per Day After The London HF
For the ETH created and burned daily I have used Dune Analytics. It’s a database tool for the Ethereum blockchain.
First the amount of ETH created per day.
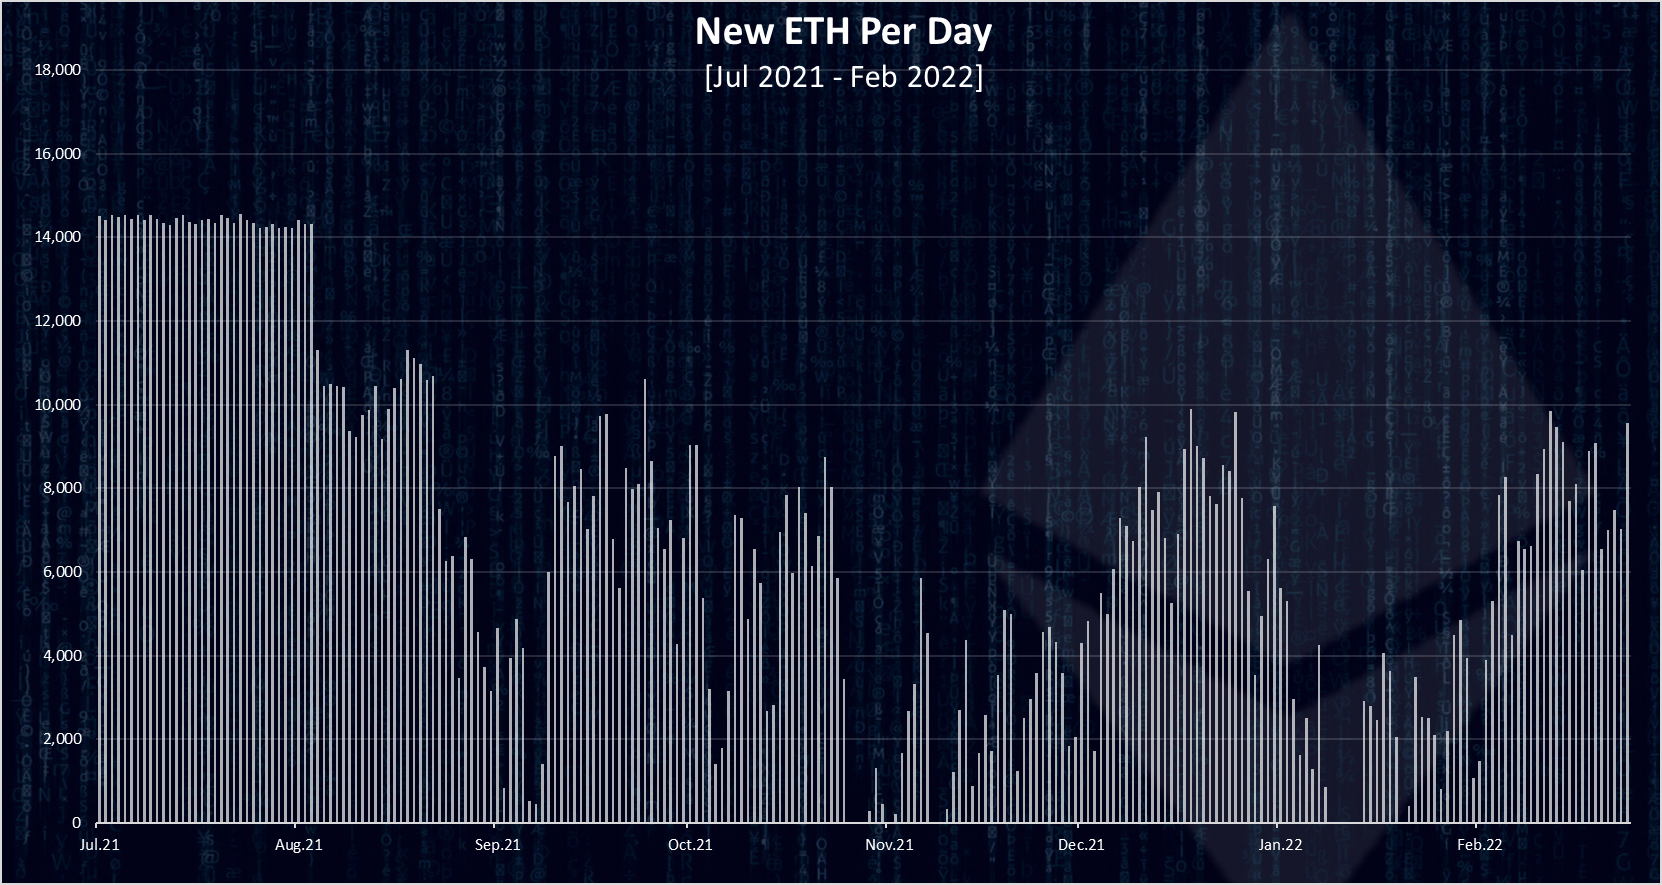
We can see data here starting from July 1st, for context. Before the HF as mentioned the daily inflation was around 14k and since then a drop in the daily inflation after the implementation of the London HF.
Next the important thing.
Ethereum Burned Per Day After The London HF
Here are the numbers for the Ethereum burned per day.
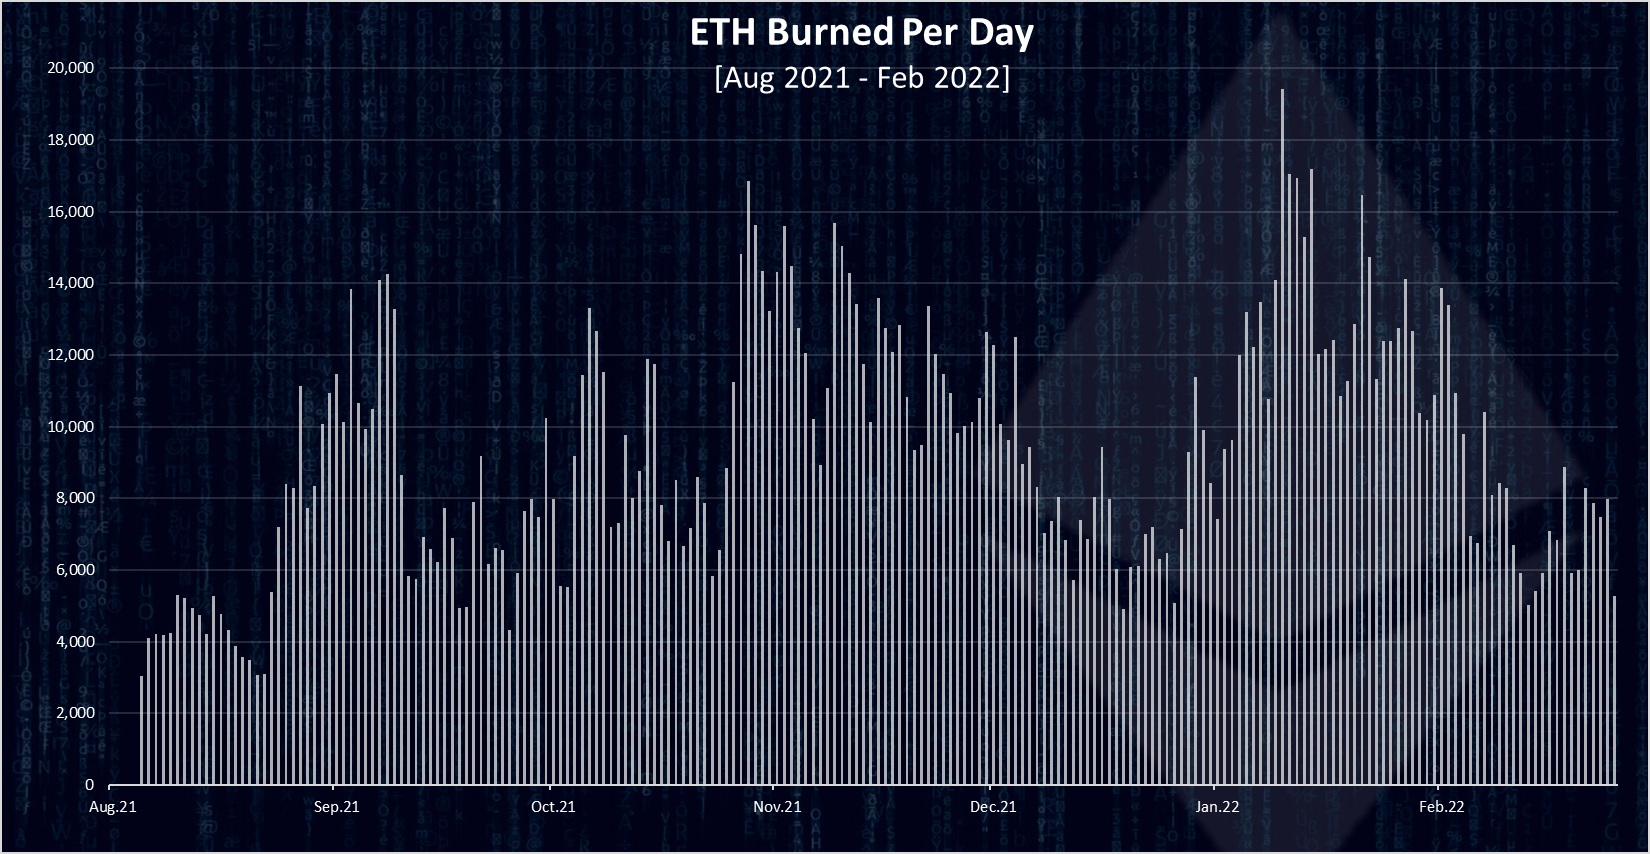
As mentioned, I’m using Dune Analytics for the numbers. I have forked a query that was showing the numbers for ETH burned per hour and adjusted it for daily burns.
We can see that there have been a few spikes in the daily burns. At first there was around 5k ETH burned daily, then an increase to more then 14k. The highest amount of ETH burned was in November and then again in January this year. On one occasions there was more then 18k ETH burned in a day in January 2022.
Since the HF, on average there is 9.3k ETH daily with a total of 1.9M ETH burned. At a price of $2.7k this is more then 5 billions ETH in USD value burned.
Share Of The ETH Burned From The Total Inflation
When we plot the burned vs created ETH per day, we get this.
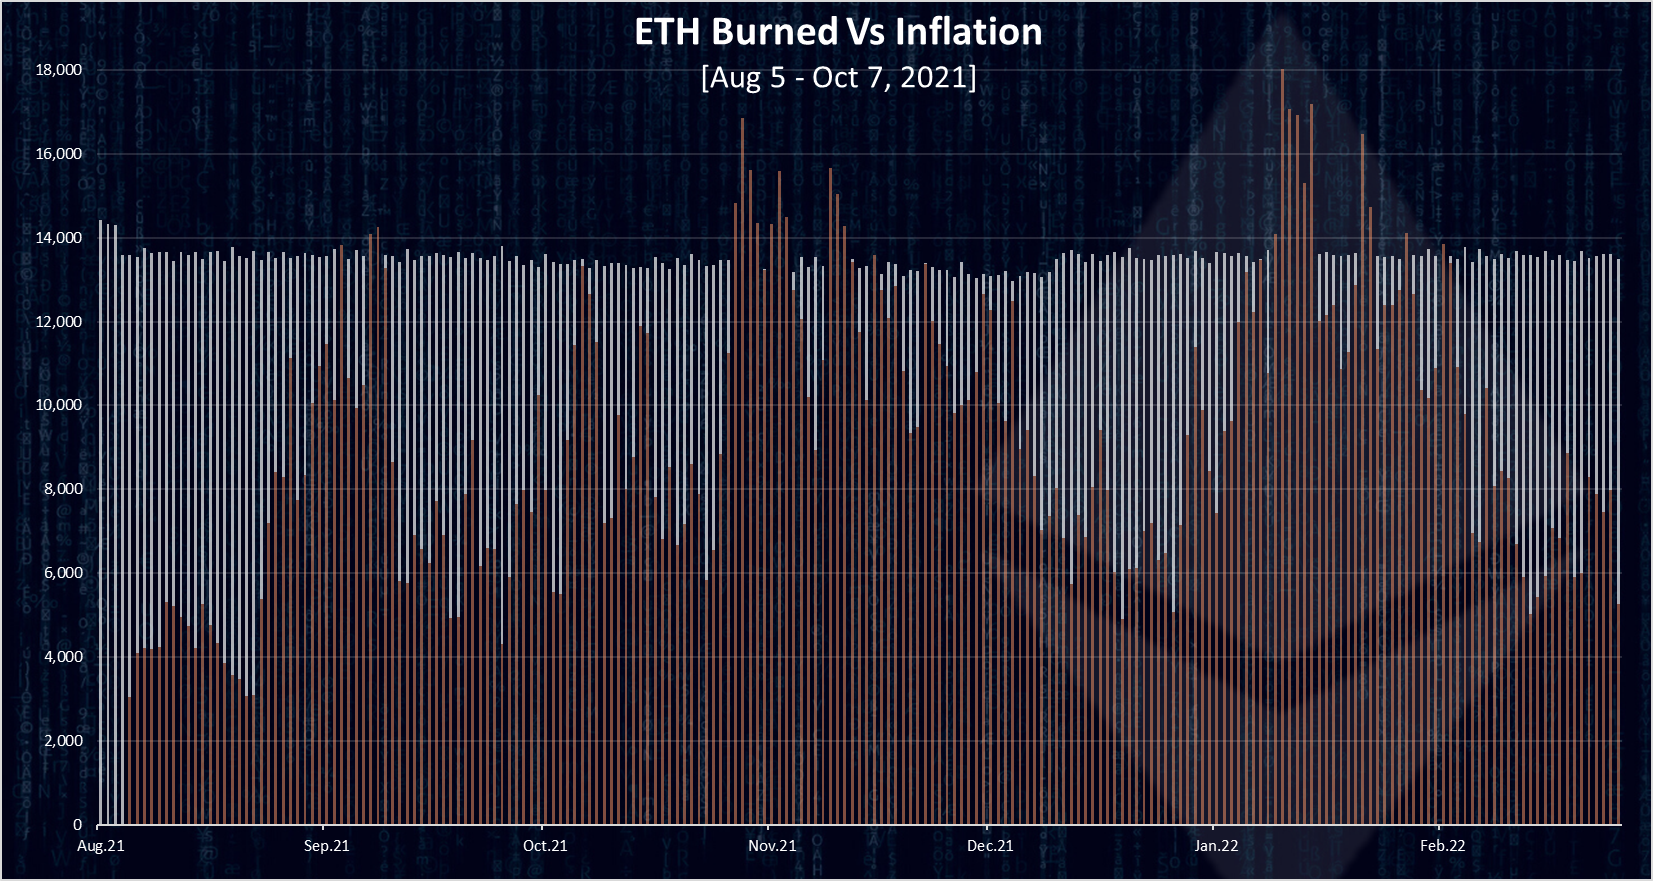
The burns have reduced the effective ETH inflation on average of 4.1k ETH per day, down from the 13.5k. On a few occasions the amount of ETH burned in the day was higher then the inflation and ETH was deflationary on those days.
If we plot all the ETH burned vs created for the period, we get this pie.
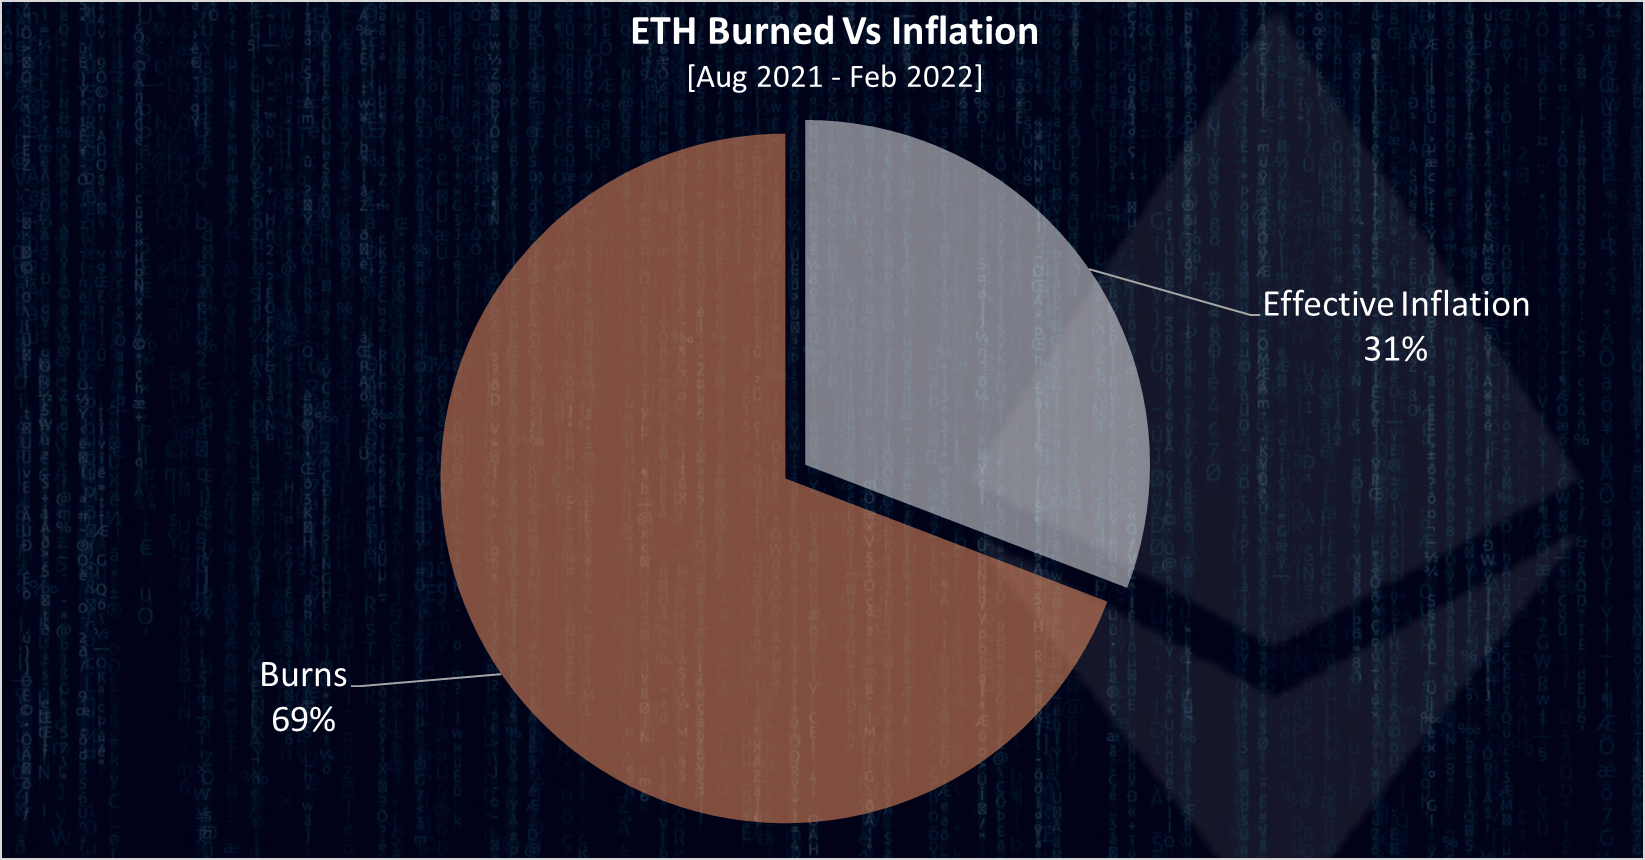
The ETH burns have reduced the inflation for 70%!
The effective ETH inflation is now only 30% from what it was before the HF. Notice that this is the case for the last period, and it doesn’t mean it will continue in this way.
Monthly and Yearly Inflation
The chart for the monthly inflation looks like this.
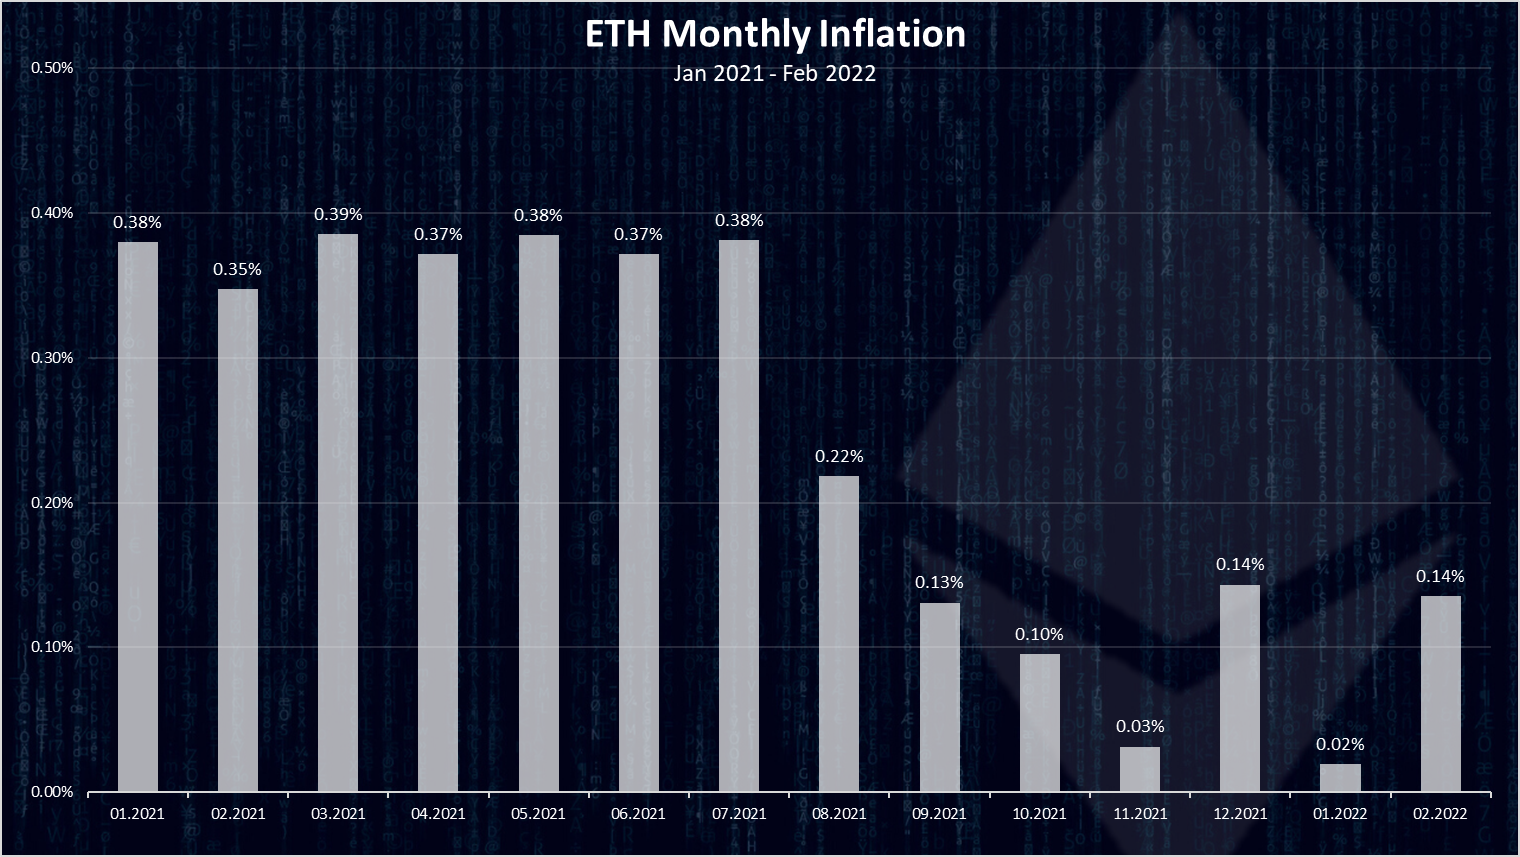
Before the London HF the monthly inflation was around 0.38%. After the inflation we can see a sharp drop with January being at its lowest with only 0.02% inflation for the month. November has also been low with 0.03%. On average the monthly inflation is 0.11% now.
What about the yearly inflation?
| Year | ETH Inflation |
|---|---|
| 2016 | 12.95% |
| 2017 | 9.57% |
| 2018 | 7.15% |
| 2019 | 4.56% |
| 2020 | 4.36% |
| 2021 | 3.24% |
| 2022 projected | 1.32% |
The yearly data is more of a standard number when measuring inflation.
We can see that the ETH yearly inflation in the last six years has been constantly decreasing. At first it was almost 13% in 2016, while in 2021 it is 3.2%. The projections for 2022 is around 1.3% but this might not end accurate. Even if 2022 ends with 2% this will still be a low inflation and very close to the Bitcoin 1.8% that is now. On a monthly level, ETH has lower inflation then Bitcoin for every month after September 2021. Bitcoin inflation on a monthly level is 0.15%, and ETH has been coastally lower than that since the HF.
Bitcoin still has the cap in its inflation and the overall security in its monetary policy as an advantage. The ETH supply and inflation is unknow for the future, but the overall trend has been down. With the implementation of Proof of stake these number might get further down and ETH ends up deflationary. Time will tell!
All the best
@dalz
Posted Using LeoFinance Beta
How does this data account for all the ETH locked in the beacon chain and the fact that the complete supply isn't fully auditable no one can provide an accurate number on the circulating supply the data from etherscan is only one provider so how can anyone be sure of the numbers, let alone the math
Posted Using LeoFinance Beta
This sounds like a BTC maxi talke :) Although it has valid points.
Running full node on ETH is expensive and Infura is one of the few that does it .... ethscan is getting data from the Infura node.
lol you can label it what you want, but i'm just asking questions, and im getting no answers, even if you're running a pruned node/uncle you're still only getting an estimate since eth doesn't have a block height.
I don't regard eth as money so I guess this isn't a problem for users who want to speculate on it, but then whats the point of the blockchain? To hold immunutable estimates?
Not sure what's the end goal of your comment and point here ... I mentioned that it is a valid concern, the BTC vs ETH is a long and ongoing debate, I have no intention, abilities or understanding of resolving it here, or taking sides.
In my vague understanding, I see them as two different assets, BTC cant do everything and it is not trying to do everything, it is a very specific asset and for sure it deserve all the respect in the world for starting the whole thing. On the other side the market has show in the last 5 years that there is a demand for assets like ETH. Its personal decision what exposure do you want from each.
Nice one and this is good to see
Wow, you really did a good job.i appreciate your effort so much. nice analysis
Tnx!
Well, i wonder how it will be in ETH 2.0
Make sense
Posted Using LeoFinance Beta
Nice overview
This make it easier to be understood about crypto inflation
The rewards earned on this comment will go directly to the person sharing the post on Twitter as long as they are registered with @poshtoken. Sign up at https://hiveposh.com.
That's great. They should reduce their transaction fee
Posted Using LeoFinance Beta