Image generated with the AI of Bing
ENGLISH
Hello my friends, as I commented earlier, this is the second part of the previous post, in which I talked about technical analysis and which indicators I used the most.
HIVE TOKEN ANALYSIS
Without further ado, here is my humble technical opinion on the behavior of the HIVE token applying everything I discussed in the previous post.
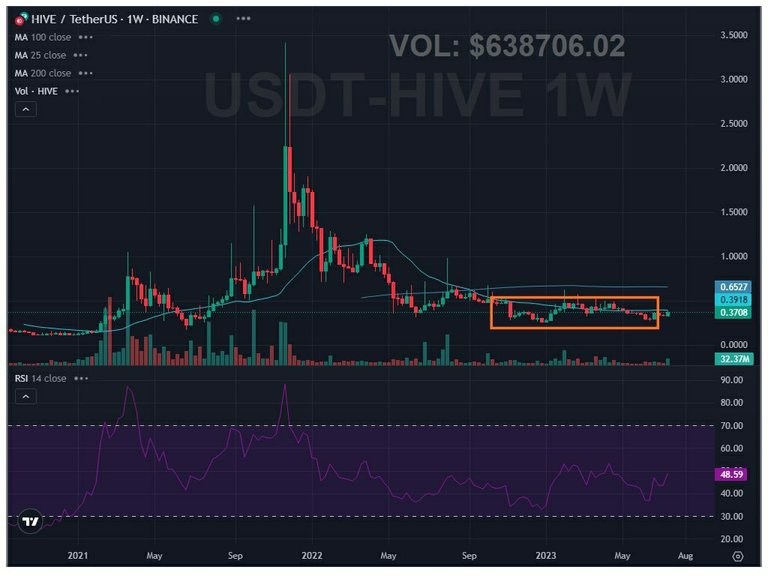
Image taken from Tradingview and edited on my Xiaomi Redmi Note 6 phone.
Firstly as we can see in the weekly time frame chart we can see that the pair has been in a downtrend in which we can clearly see the successive lower highs and lower lows, however, we all know that the accumulation phase occurs after a downtrend and that is what I could see in recent months as I point out in the chart box above, also as we had commented after an accumulation phase comes the beginning of an uptrend, and the RSI is still slightly in the negative zone which indicates that the bearish are in control but apparently not for long.
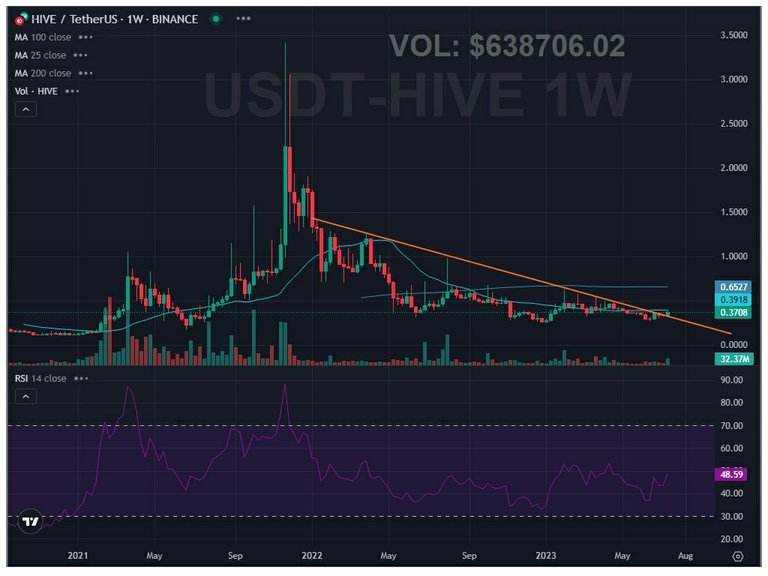
Image taken from Tradingview and edited on my Xiaomi Redmi Note 6 phone.
As I show you in the previous image the price broke above the downtrend line that acted as support, we should wait for confirmation and for the price to close above and retest to turn it into resistance.
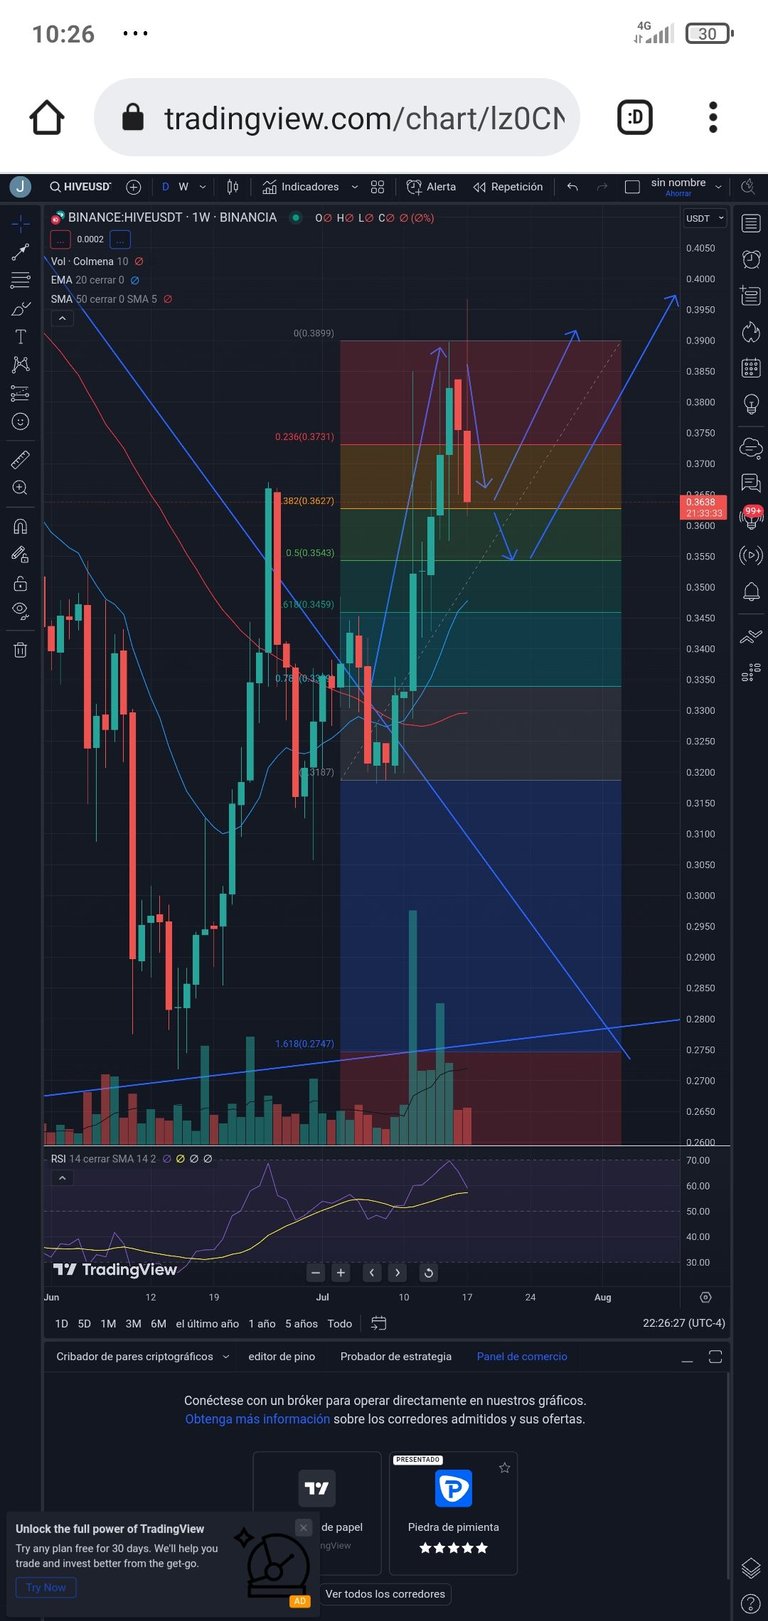
Screenshot on my phone, from my Tradingview account.
Looking at the daily timeframe chart we can see that since the day the price broke and closed above the descending support line, it has kept rising to a high of 0.3967 USD, where the bearish stopped the price and since then it is correcting, the long wick in the candle shows that it is selling and taking profits on rallies, however the RSI in positive zone indicates that buyers are in control and the sentiment is bullish, if they failed to hold the price above the Fibonacci retracement level of 38. 2 %(0.3627 USD) the next support would be at the 50% level(0.3543 USD) and if this level is broken the price could fall to the 61.8% level(0.3459 USD).
If the level of 0.3459 USD is broken and the price falls below the 20-day EMA the next move could be to the 50-day MA at the level of 0.3290 USD, in case this does not happen and the upward momentum continues the next level to test would be the level of 0.4175 USD.
In general this is my analysis, however I will leave you one last image of the chart in one week time frame, so you can tell me if you see the same as me 🤔👇👇.
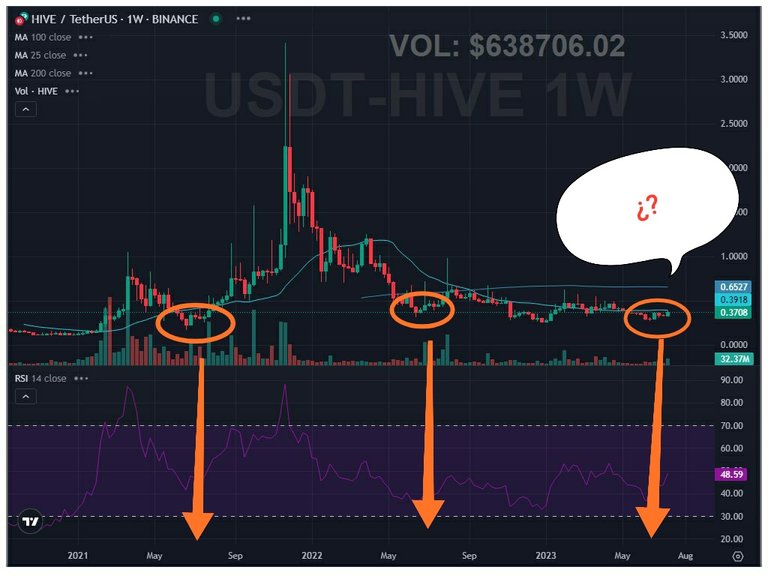
Image taken from Tradingviewand edited on my Xiaomi Redmi Note 6 phone.
Will history repeat itself.
Will the market prove again to be cyclical?
Do you think the Hive token will continue to rise?
Would it be healthy for the HIVE ecosystem for the price to correct and gradually consolidate and gain ground until it reaches its all-time high?
Let me know what you think.
Also let me know in the comments if you think I'm off the mark and if I'm making any mistakes in your opinion.
**YOUR OPINION IS IMPORTANT TO ME.
Greetings and until the next post,😉.
Translated and formatted with Hive Translator by @noakmilo.
You can see me on Facebook
The analysis above is merely a personal opinion, and the form and style in which I wrote it are thanks to the knowledge that I have provided the articles of the trader Rakesh Upadhyay on the site of cointelegraph and the trader Daniel Marin, and in no case constitutes an investment advice, cryptocurrencies are volatile assets and everyone must make their own market research.
ESPAÑOL
Hola mis amigos, como comenté anteriormente, esta es la segunda parte del post anterior, en el que hablaba sobre el análisis técnico y cuales eran los indicadores que más empleaba.
ANÁLISIS DEL TOKEN HIVE
Sin más dilatación les dejo acá mi humilde opinión técnica sobre el comportamiento del token HIVE aplicando todo lo que comenté en el post anterior.
*Imagen tomada de *Tradingview y editada en mi teléfono Xiaomi Redmi Note 6
Primeramente como podemos observar en el gráfico en temporalidad semanal se puede apreciar que el par ha estado en una tendencia bajista en el que se ven claramente los máximos y mínimos más bajos sucesivamente, no obstante a eso, todos sabemos que la fase de acumulación se dan después de una tendencia bajista y es lo que yo pude apreciar en los últimos meses como les señalo en el recuadro del gráfico anterior, además como habíamos comentado después de una fase de acumulación viene el inicio de una tendencia alcista, y el RSI está todavía ligeramente en zona negativa lo que indica que los bajistas tienen el control pero al parecer no por mucho tiempo.
Imagen tomada deTradingview y editada en mi teléfono Xiaomi Redmi Note 6
Cómo les muestro en la imagen anterior el precio rompió por encima de la línea tendencial descendente que actuaba como soporte, habría que esperar la confirmación y que el precio cierre por arriba y vuelva a testear para convertirla en resistencia.
Captura de pantalla en mi teléfono, de mi cuenta enTradingview
Mirando el gráfico en temporalidad diaria podemos ver qué desde el día que el precio rompió y cerró por encima de la línea de soporte descendente, se ha mantenido subiendo hasta un máximo de 0.3967 USD, donde los bajistas frenaron el precio y desde entonces se encuentra corrigiendo, la larga mecha en la vela demuestra que se está vendiendo y tomando ganancias en los repuntes, sin embargo el RSI en zona positiva indica que los compradores tienen el control y el sentimiento es alcista, si no lograran mantener el precio por encima del nivel de retroceso de Fibonacci de 38.2 %(0.3627 USD) el próximo soporte sería en el nivel de 50%(0.3543 USD) y de romperse este nivel el precio podría caer hasta el nivel del 61.8%(0.3459 USD)
Si el nivel de los 0.3459 USD se rompe y el precio cae por debajo de la EMA de 20 días el próximo paso podría ser hasta la MA de 50 días en el nivel de los 0.3290 USD, en caso de no ocurrir esto y continuar el impulso alcista el próximo nivel a testear sería la zona de los 0.4175 USD.
De forma general este es mi análisis, sin embargo te voy a dejar una última imagen del gráfico en temporalidad de una semana, para que me digan ustedes si ven lo mismo que yo 🤔👇👇.
Imagen tomada de Tradingview y editada en mi teléfono Xiaomi Redmi Note 6
¿Será que la historia se repite?.
¿Se demostrará nuevamente que el mercado es cíclico?
¿Piensas que el token Hive seguirá subiendo?
¿Sería sano para el ecosistema de HIVE una corrección del precio y que consolide poco a poco e ir ganando terreno hasta llegar a su máximo histórico? Dime qué opinas tú.
Déjame en los comentarios también si crees que estoy alejado de la realidad y si cometo algún error según tu criterio.
TU OPINIÓN ES IMPORTANTE PARA MÍ.
Saludos y hasta el próximo post,😉.
Translated and formatted with Hive Translator by @noakmilo.
Puedes verme en Facebook
El análisis antes expuesto es meramente una opinión personal, y la forma y estilo en el que lo redacté son gracias a los conocimientos que me han aportado los artículos del trader Rakesh Upadhyay en el sitio de cointelegraph y el trader Daniel Marín,y en ningún caso constituye un consejo de inversión, las criptomonedas son activos volátiles y cada cual debe hacer su propio estudio del mercado.
Posted Using LeoFinance Alpha
Posted Using LeoFinance Alpha
Congratulations @darknapol! You have completed the following achievement on the Hive blockchain And have been rewarded with New badge(s)
Your next target is to reach 100 comments.
You can view your badges on your board and compare yourself to others in the Ranking
If you no longer want to receive notifications, reply to this comment with the word
STOPCheck out our last posts: