English
Hello my friends!. Today I want to talk to you about Technical Analysis in the market of cryptocurrencies, because I am slowly perfecting my skills, and I think that one more way to learn is to listen to other criteria, I will give you my impressions on the subject, I will analyze and give my humble technical opinion on the Hive / USDT pair, I will tell you what technical indicators I use and what I understand about them, and I will be waiting for your opinions to know which ones you use, and how you do it.I also take the opportunity to thank my friend @crptogeek for helping me and clarifying all my doubts regarding the creation of content in the Leofinance community.
Image generated with bing.com AI
THE OBJECTIVE OF THIS POST:
Make a brief review of what Technical Analysis is, give my impressions and the ways in which I analyze the pairs of currencies, as well as some of the ways I use to validate these analyzes and that serve me to perfect my skills in the subject.
That it serves as a precedent for a second Post in which I will give my experiences of how I apply this analysis to make trading operations in an exchange with a minimum of 2 USDT to operate, which has a demo account, and a lot of bonuses that allow us to train our skills with minimal losses if we have a good risk management.
Give an analysis of the main token of the HIVE blockchain, which allows us to create a dialogue in which we can know other opinions and points of view, allowing us to nourish the knowledge of what each one can contribute.(This objective will be treated in a second post, so as not to extend this)
GETTING DOWN TO BUSINESS.
I can say that the Technical Analysis is quite broad and must always be accompanied by a Fundamental Analysis, which, in my opinion, is very powerful and can invalidate in a matter of microseconds any analysis that you have projected based only on charts and technical indicators, or it can favor your projection, the truth is that you have to take it into account and always prepare your stop loss, because in my experience market manipulation has swept me away in a few occasions, losing everything I have gained, simply for not managing the risk correctly, but I will talk about these issues in the next post.
We can say that it is divided into two types:
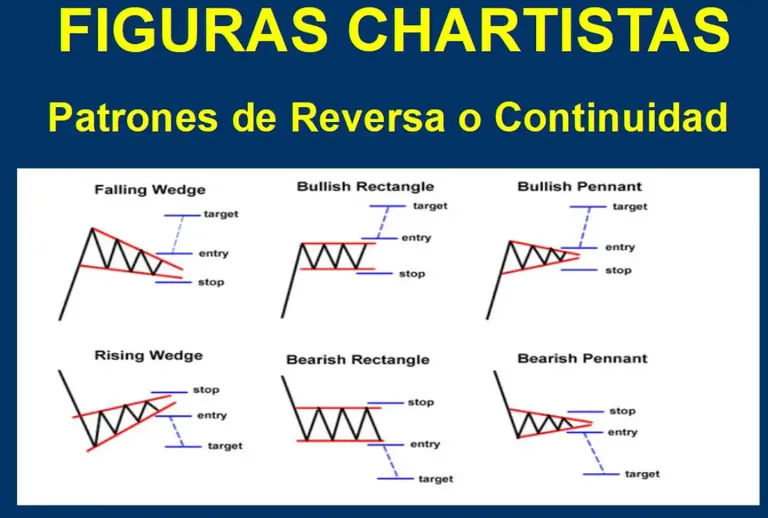
Chartism, in which the Japanese candlestick patterns are used, figures such as the pennant, trend channels, symmetrical triangle, double floor, double top, etc., and all these figures need a confirmation executed by the price to be valid.
Technical indicators, in which a series of mathematical models that work on the price of the assets are used, for example moving averages, Fibonacci Retracement, RSI, Volume, etc., each one gives different information with which we can corroborate our prediction.
It should be noted that the market works by impulses and reversals, as well as being cyclical, going through four stages.
*Accumulation
*Uptrend
*Distribution
*Downtrend
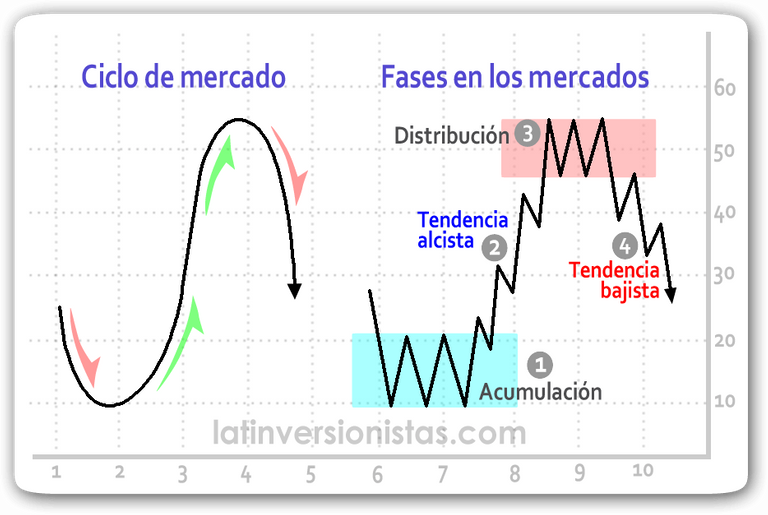
During the accumulation the price rather remains sideways after a bearish trend, as institutional purchases are made without the price exploding, thus accumulating the asset at low prices before the bullish trend starts, when we analyze an asset it is important to determine if it is in an accumulation phase, since it would be a good investment area.
The bullish trend starts when higher lows and highs start to appear successively, it is important to identify the trend of the asset when trading with them, because you should never trade against the trend, and the advantage is to identify the beginning of a trend, to enter early and maximize profits.
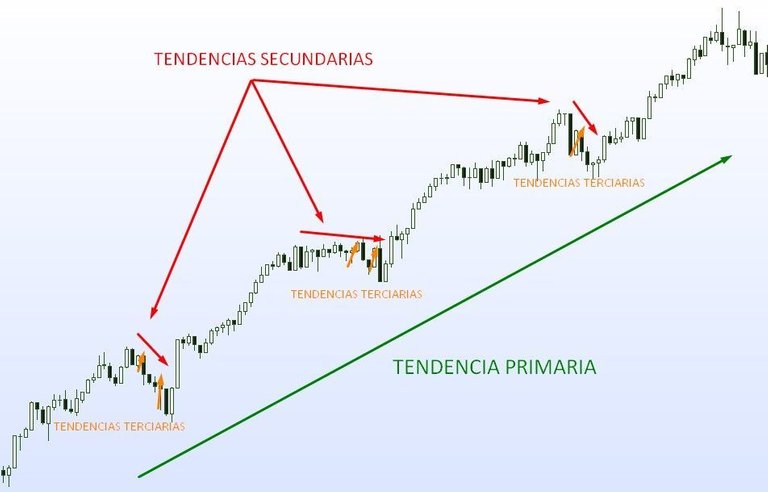
I must point out that to identify primary trends, you must look at the charts in 4-hour or 1-day timeframes, and if you want to project the asset's behavior in the long term, I recommend looking at longer timeframes, a week or a month. The idea is to go from longer to shorter timeframes, which allows us to identify the primary trend, and then identify the secondary and tertiary trends contained within each other, which we can see in shorter timeframes.
During Distribution, institutional sales or profit-taking occur, and it is the area where, upon its completion, the price may start the bearish trend. We must identify these areas and be able to take our profits.
The bearish trend begins when minimums and maximums begin to decrease successively, and it is essential to identify them to make our decisions and not risk the profits, waiting for the opportunity again to re-enter the market.
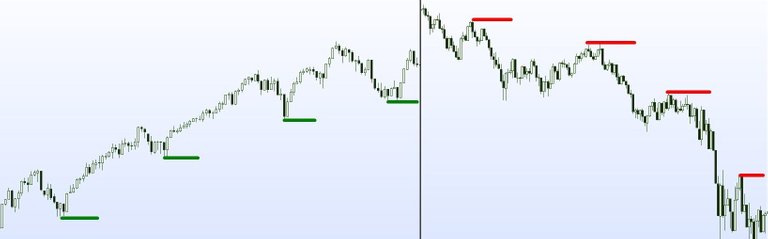
Bullish trend on the left, bearish trend on the right
Source
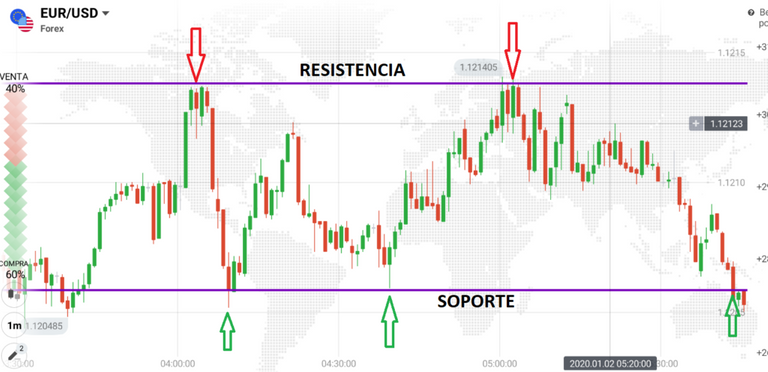
To do my analysis, the first thing I do is identify if the pair is in an uptrend and for that I realize if the price has gone up, giving minimums and maximums higher successively, then I define the support lines that are nothing more than those areas in which the price has decreased enough so that the asset can be purchased in an investment area where demand increases, causing the price to rebound and return to the upside. To identify it, just match a line with the largest number of points in which the price rebounded and returned to the upside.
The resistance zone is the opposite, and is at the levels where the price has risen enough and there is a large accumulation of sell orders, at these levels there is an increase in offers, causing the price to move lower, they are plotted on the chart by matching a line with the largest number of points at which the price returned lower.
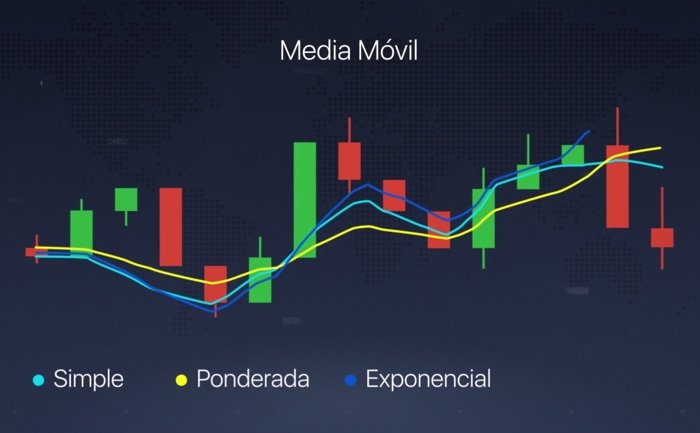
I also set up two moving averages, an Exponential Moving Average (EMA) of 20 periods and a Simple Moving Average (MA) of 50 periods, with a 1-day timeframe, this tells me the average closing price over the last 20 and 50 days and serves to detect buying and selling opportunities, identify changes in trend and constitute supports or resistances.
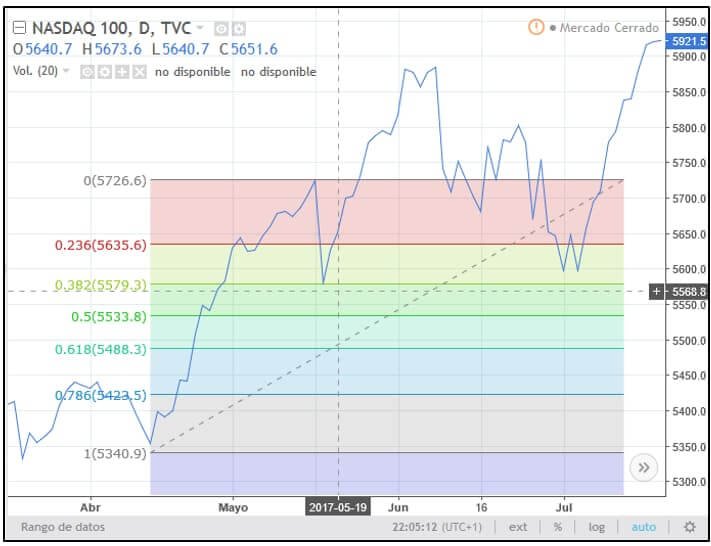
I also like working with the Fibonacci Retracement indicator which contains lines that indicate percentage changes in a retracement and act as supports and resistances, I mainly operate with the levels between 0.382 and 0.618, placing buy and sell orders before the supports and resistances that indicate those lines to me.
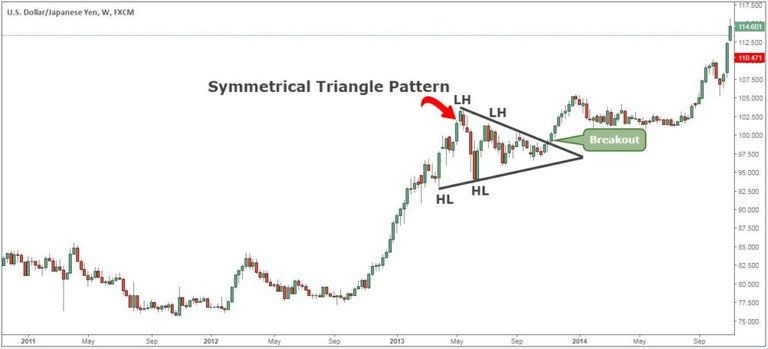
I also like the Chartism a lot, and when the flags and symmetrical triangles appear in which the price is contracting until it explodes upwards or downwards, I wait for confirmation, because it may be a false break, so I enter with a purchase if it is upwards, and I keep my stop loss configured.
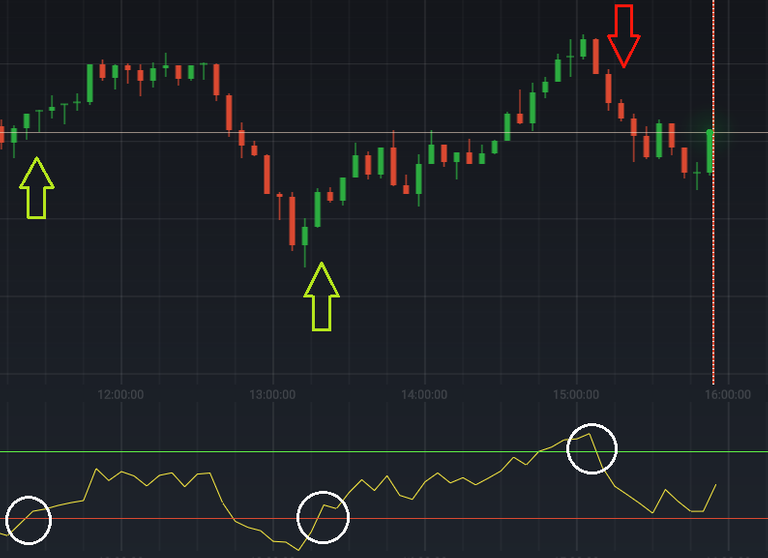
I also add the RSI (Relative Strength Index) indicator, configured at 14, which measures the strength index of the trend and gives me a measure of whether the price is overbought, oversold or is in neutral terms between buyers and sellers.
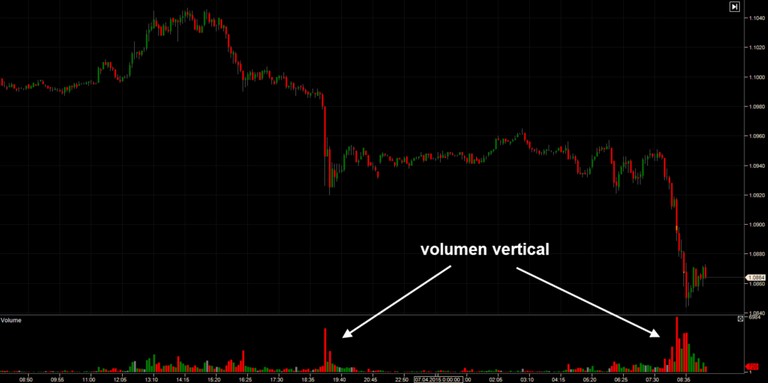
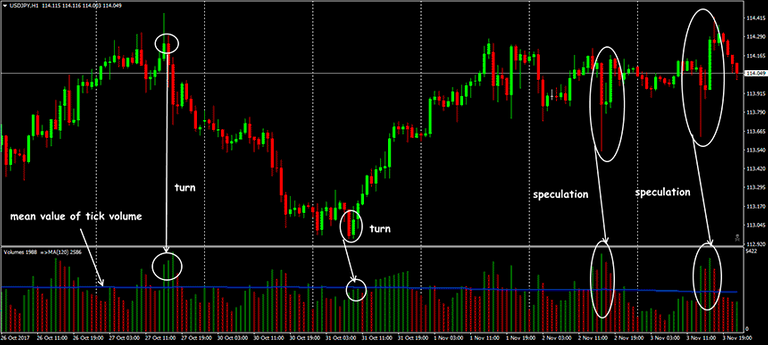
As a last indicator I tell you about the Volume which I use to determine the number of participants in the trade and to have an idea of the strength of the movement in question, since a higher volume reflects greater interest and therefore greater strength of the movement that combined with another indicator can help us make decisions.
In general I have told you the main indicators that I use and how I use them, however I am still a trader novice and it takes a lot of patience and practice to overcome, be disciplined, not allow emotions to dominate, something that I have not yet overcome, but that with each error I have been improving.
Finally I must tell you that all this analysis is accompanied by always keeping in mind how the BTC/USDT pair is moving and the dominance of bitcoin, because for example, when BTC/USDT lateralizes and the dominance is decreasing, altcoin starts to rise. It is a subject that must be studied if or if.
Previously I told you that I used some ways to validate my analysis, and what I do is rely on more experienced traders and platforms that offer good information,
An example of this is the cointelegraph site where the prices of the main cryptocurrencies are analyzed, reading it gives you a vision of how to do the analysis, and check for yourself.
You can look for the investing.com site where they give you a summary of the main technical indicators, pivot points, news, economic calendar where you can see if the events that are coming will generate high or low volatility, and much more information about the asset in question.
It is also very helpful the trader Daniel Marín who makes excellent live analysis on the main cryptocurrencies, keeps you alert about every possible market movement and gives you its fundamentals, you can look for him in his Telegram channel or in Youtube
In this way I conclude the first part of this post, and I will leave you my impressions about the action of the HIVE token price in the second part, where I will apply what was previously exposed.
This topic is quite extensive and must be complemented with other forms of analysis, and each one has its strategy, so tell me your opinion in the comments, which indicators you use and how well they have worked for you.
A greeting and until the next post, 😉.
Translated and formatted with Hive Translator by @noakmilo.
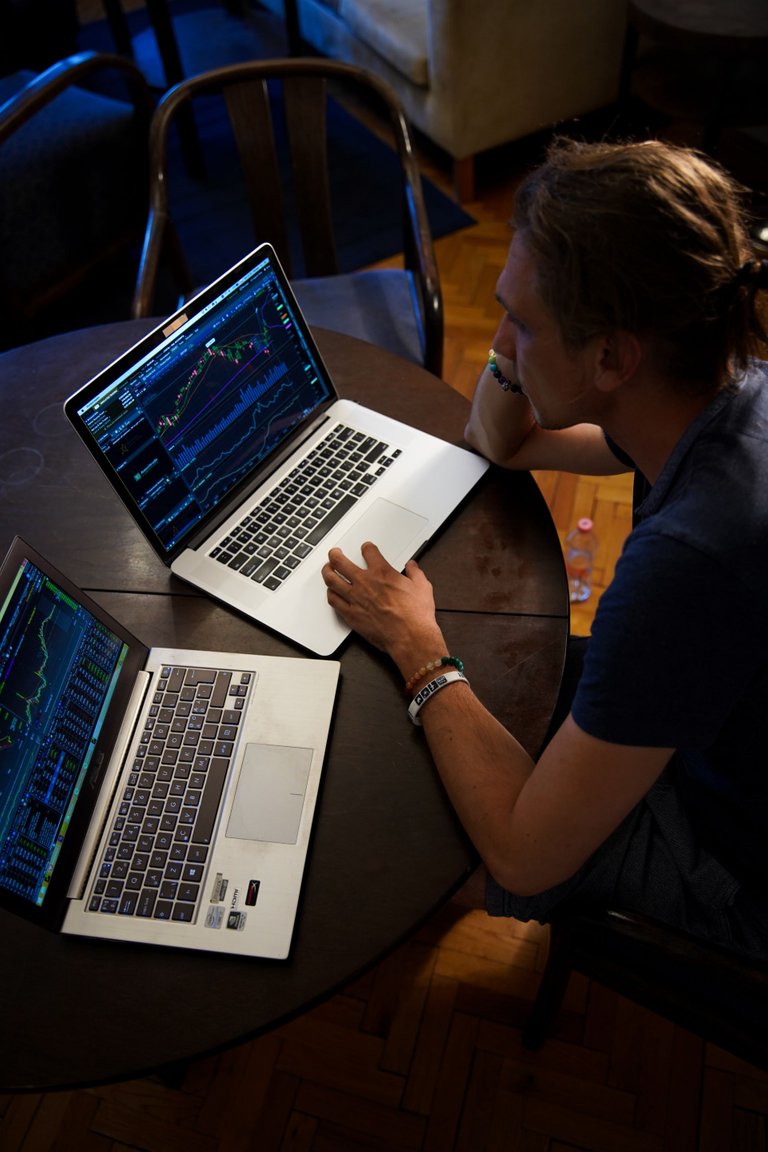
The cover photo is by Adam Nowakowski
You can see me on Facebook
ESPAÑOL
Saludos mis amigos!. Hoy quiero dialogar con ustedes sobre el Análisis Técnico en el mercado de las criptomonedas, pues estoy perfeccionando poco a poco mis habilidades, y pienso que una forma más de aprender es escuchar otros criterios, yo les daré mis impresiones sobre el tema, analizaré y daré mi humilde opinión técnica sobre el par Hive/USDT , les comentaré que indicadores técnicos uso así como lo que entiendo sobre ellos, y estaré a la espera de sus opiniones para saber cuáles usan ustedes, y como la hacen.También aprovecho la oportunidad para agradecer al amigo @crptogeek por ayudarme y aclararme todas las dudas respecto a la creación de contenido en la comunidad de @leofinance.
Imagen generada con la IA de bing.com
EL OBJETIVO DE ESTE POST:
Hacer una breve reseña de que es el Análisis Técnico, darles mis impresiones y las formas en las que analizo los pares de monedas, así como algunas de las vías que empleo para validar dichos análisis y que me sirven para perfeccionar mis habilidades en la materia.
Que sirva como precedente de un segundo Post en el que daré mis experiencias de como aplico este análisis para realizar operaciones de trading en un exchange con un mínimo de 2 USDT para operar, el cual tiene cuenta demo, y una gran cantidad de bonos que permiten adiestrar nuestras habilidades con pérdidas mínimas si tenemos una buena gestión del riesgo.
Dar un análisis del token principal de la blockchain HIVE, que permita crear un diálogo en el que podamos conocer otras opiniones y puntos de vista, permitiéndonos nutrir los conocimientos de lo que pueda aportar cada cual.(Este objetivo será tratado en un segundo post, para no extender este)
ENTRANDO EN MATERIA
Puedo decir que el Análisis Técnico es bastante amplio y debe siempre ir acompañado de un Análisis Fundamental, el cual, en mi opinión, es muy poderoso y te puede invalidar en cuestión de microsegundos cualquier análisis que hayas proyectado basándote solamente en los gráficos y los indicadores técnicos, o puede favorecer tu proyección, lo cierto es que hay que tenerlo en cuenta y preparar siempre tu stop loss, ya que por experiencia la manipulación del mercado me ha barrido en unas cuantas ocasiones, perdiendo todo lo que he ganado, sencillamente por no gestionar el riesgo correctamente, pero de estos temas hablaré en el próximo post.
Podemos decir que se divide en dos tipos:
El Chartismo, en el que se emplean los patrones de velas japonesas, figuras como el banderín, canales de tendencia, triángulo simétrico, doble suelo, doble techo, etc., y todas estas figuras necesitan de una confirmación ejecutada por el precio para que sean válidas.
Los indicadores técnicos, en el que se emplean una serie de modelos matemáticos que trabajan sobre el precio de los activos, por ejemplo las medias móviles, Retroceso de Fibonacci, RSI, Volumen, etc., cada uno da una información diferente con la que podemos corroborar nuestra predicción.
Hay que tener en cuenta que el mercado trabaja por impulsos y retrocesos, además de ser cíclico, pasando por cuatro etapas.
Acumulación
Tendencia alcista
Distribución
Tendencia bajista
Durante la acumulación el precio más bien se mantiene lateralizando después de una tendencia bajista, pues se hacen compras institucionales sin que se dispare el precio, logrando con esto acumular el activo a bajos precios antes de que comience la tendencia alcista, cuando hacemos el análisis de un activo es importante determinar si la misma se encuentra en una fase de acumulación, pues sería una buena zona de inversión.
La tendencia alcista comienza cuando empiezan a aparecer mínimos y máximos más altos sucesivamente, es importante identificar la tendencia del activo a la hora de operar con ellos , pues nunca se debe operar contra tendencia, y la ventaja está en identificar un inicio de tendencia, para entrar de forma temprana maximizando las ganancias.
Debo destacar que para identificar las tendencias primarias se deben ver los gráficos en temporalidades de 4 horas o 1 Día y si se quiere proyectar a largo plazo el comportamiento del activo, recomiendo verlas en mayores temporalidades, una semana o un mes, la idea es ir de temporalidades mayores a menores, y esto nos permite identificar la tendencia primaria, y luego ir identificando las tendencias secundarias y terciarias contenidas unas dentro de otras, las que podemos ver en temporalidades menores.
Durante la Distribución ocurren las ventas institucionales o tomas de ganancias, y es la zona donde llegada a su finalización, el precio puede empezar la tendencia bajista, hay que identificar estás zonas, y poder tomar nuestras ganancias.
La tendencia bajista comienzan cuando empiezan a darse mínimos y máximos más bajos sucesivamente, y es fundamental identificarlas para tomar nuestras decisiones, y no arriesgar las ganancias, esperando la oportunidad nuevamente para volver a entrar al mercado.
Tendencia alcista a la izquierda, tendencia bajista a la derecha
Fuente
Para hacer mis análisis lo primero que hago es identificar si el par está en una tendencia alcista y para eso me percato si el precio ha ido en aumento, dando mínimos y máximos más altos sucesivamente, entonces defino las líneas de soportes que no son más que esas zonas en la que el precio ha bajado lo suficiente como para que el activo pueda ser comprado en una zona de inversión en la que aumenta la demanda provocando que el precio rebote y se devuelva al alza, para identificarla basta con hacer coincidir con una línea la mayor cantidad de puntos en el que el precio rebotó y se devolvió al alza.
La zona de resistencia es lo contrario, y está en los niveles donde el precio ha subido lo suficiente y hay un gran cúmulo de órdenes de venta, en estos niveles hay un aumento de las ofertas, provocando que el precio se mueva a la baja, se trazan en el gráfico haciendo coincidir con una línea la mayor cantidad de puntos en los que el precio se devolvió a la baja.
Además configuro dos medidas móviles, una Media Móvil Exponencial (EMA) de 20 períodos y una Media Móvil Simple (MA) de 50 periodos, con temporalidad de 1 día, esto me indica el promedio de cierre de los precios durante los últimos 20 y 50 días y sirven para detectar oportunidades de compra y venta, identifican cambios de tendencia y constituyen soportes o resistencias.
Me gusta también trabajar con el indicador Retroceso de Fibonacci el cual contiene líneas que indican los cambios porcentuales en un retroceso y actúan como soportes y resistencias, principalmente opero con los niveles entre 0.382 y 0.618, colocando las órdenes de compra y venta antes de los soportes y resistencias que me indiquen dichas líneas.
Me gusta bastante el Chartismo, y cuando se dan los banderines y triángulo simétricos en los que el precio se va contrayendo hasta explotar al alza o a la baja, espero la confirmación, pues puede ser una falsa ruptura, entonces entro con una compra si es al alza, y mantengo mi stop loss configurado.
Agrego también el indicador RSI (Índice de Fuerza Relativa), configurado en 14, el cual mide el índice de fuerza de la tendencia y me da una medida de si el precio está sobre comprado, sobre vendido o se encuentra en términos neutrales entre compradores y vendedores.
Cómo último indicador te cuento sobre el Volumen el cual uso para determinar la cantidad de participantes en el comercio y tener una idea de la fuerza del movimiento en cuestión, ya que un mayor volumen refleja mayor interés y por ende mayor fuerza del movimiento que combinado con otro indicador nos puede servir de ayuda para tomar decisiones.
De forma general te he contado los principales indicadores que uso y como los empleo, sin embargo todavía soy un trader novato y se necesita mucha paciencia y práctica para superarse, ser disciplinado, no permitir que te dominen las emociones, algo que todavía no he superado, pero que con cada error he ido mejorando.
Por último debo decirte que todo este análisis va aparejado a tener presente siempre cómo se está moviendo el par BTC/USDT y la dominancia del bitcoin, pues por ponerte un ejemplo, cuando BTC/USDT lateraliza y la dominancia está bajando, las altcoin empiezan a subir. Es un tema que hay que estudiar si o si.
Anteriormente te dije que usaba algunas vías para validar mis análisis, y lo que hago es apoyarme en traders más experimentados y plataformas que ofrecen buena información,
Ejemplo de esto es el sitio de cointelegraph en el que se analizan los precios de las principales criptomonedas, leerlo te da una visión de como hacer el análisis, y comprobarte a ti mismo.
Puedes buscar el sitio investing.com en el que te dan un resumen de los principales indicadores técnicos, puntos de pivote, noticias, calendario económicos donde puedes ver si los eventos que se avecinan generaran alta o baja volatilidad, y mucha más información sobre el activo en cuestión.
También es de gran ayuda el trader Daniel Marín el cual hace excelentes análisis en vivo sobre las principales criptomonedas, te mantiene en alerta sobre cada posible movimiento del mercado y te da sus fundamentos, puedes buscarlo en su canal de Telegram o en Youtube
De esta forma concluyo la primera parte de este post, y te dejare mis impresiones sobre la acción del precio del token HIVE en la segunda parte, dónde aplicaré lo antes expuesto.
Este tema es bastante amplio y hay que complementarlo con otras formas de análisis, y cada cual tiene su estrategia, por eso dime tú opinión en los comentarios, que indicadores usas y que tan bien te han resultado.
Un saludo y hasta el próximo post,😉.
La foto de la portada es de Adam Nowakowski
Puedes verme en Facebook
Translated and formatted with Hive Translator by @noakmilo.
Posted Using LeoFinance Alpha
Posted Using LeoFinance Alpha
Posted Using LeoFinance Alpha
Congratulations @darknapol! You have completed the following achievement on the Hive blockchain And have been rewarded with New badge(s)
Your next target is to reach 500 upvotes.
You can view your badges on your board and compare yourself to others in the Ranking
If you no longer want to receive notifications, reply to this comment with the word
STOP