It has been a while since the last time I made a post related to technical analysis, and I figured the best way to start was to share my view on the 2 major cryptos and how is their price structure at this very moment using 3 of the most commonly used timeframes, the daily, the 4 hour and the 1 hour.
As a reminder, if you wanna check the concepts and type of analysis I have been learning since a year ago, feel free to check my previous posts about this topic: Introduction to my journey learning technical analysis so far and About the fractal nature of price and overviews related to support, resistance, trendlines as well as supply & demand zones with examples.
Red zones are from the daily timeframe.
Yellow zones are from the 4h timeframe.
And green zones are from the 1h timeframe.
Let's start today's top-down analysis with BTC. This is its current daily structure:
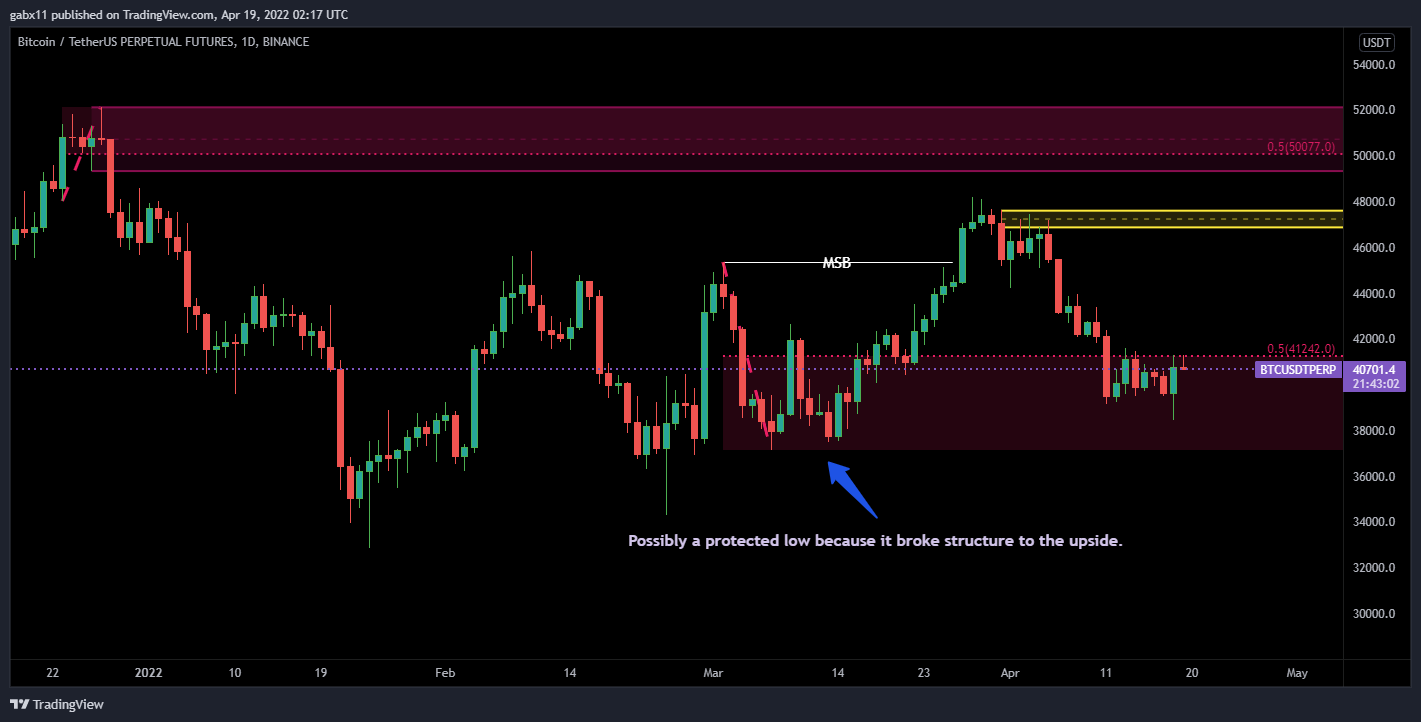
The daily structure can be considered bullish since it broke the February range on March 27. Currently, it is visiting its mentfxblock, or impulse block as I prefer to call them, that broke the range. The current downtrend could potentially be a mitigation of the demand zone to then continue with the bullish trend towards the recently established swing high at around 48k. Above this high is a supply zone which makes it a likely target for any potential long.
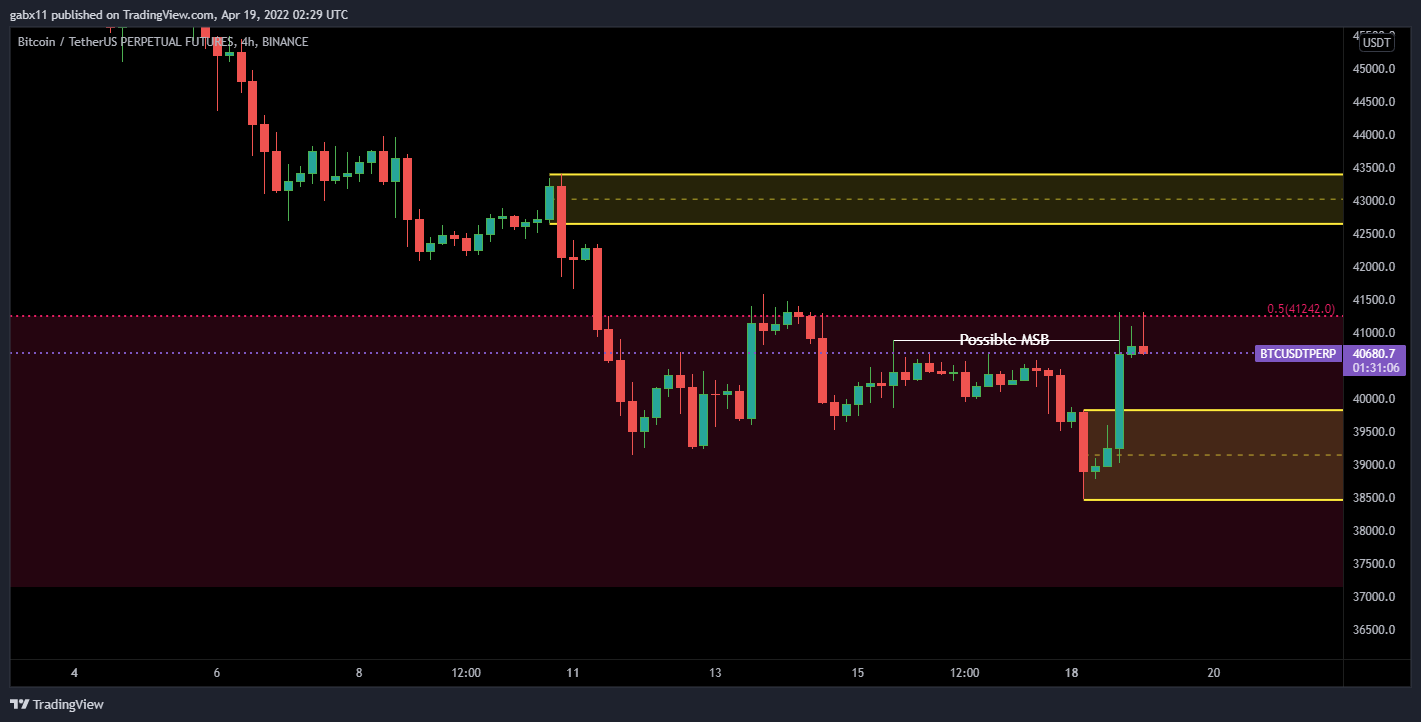
The 4h structure is less bullish, with several swing highs and their corresponding supply zones waiting to possibly stop any potential rally. Since higher timeframes hold more weight when there are clashes between the structures of different timeframes, the daily demand zone might be strong enough to stop the 4h bearish structure from continuing downward.
As shown in the image, there is a potential bullish market structure break on the 4H but if you notice the candles, they have been unable to continue their rally and are currently showing extremely bearish wicks. Mitigating the possible demand zone (the yellow box at the bottom), could be necessary to continue the upward push and tap the key swing high and its supply zone (yellow box at the top).
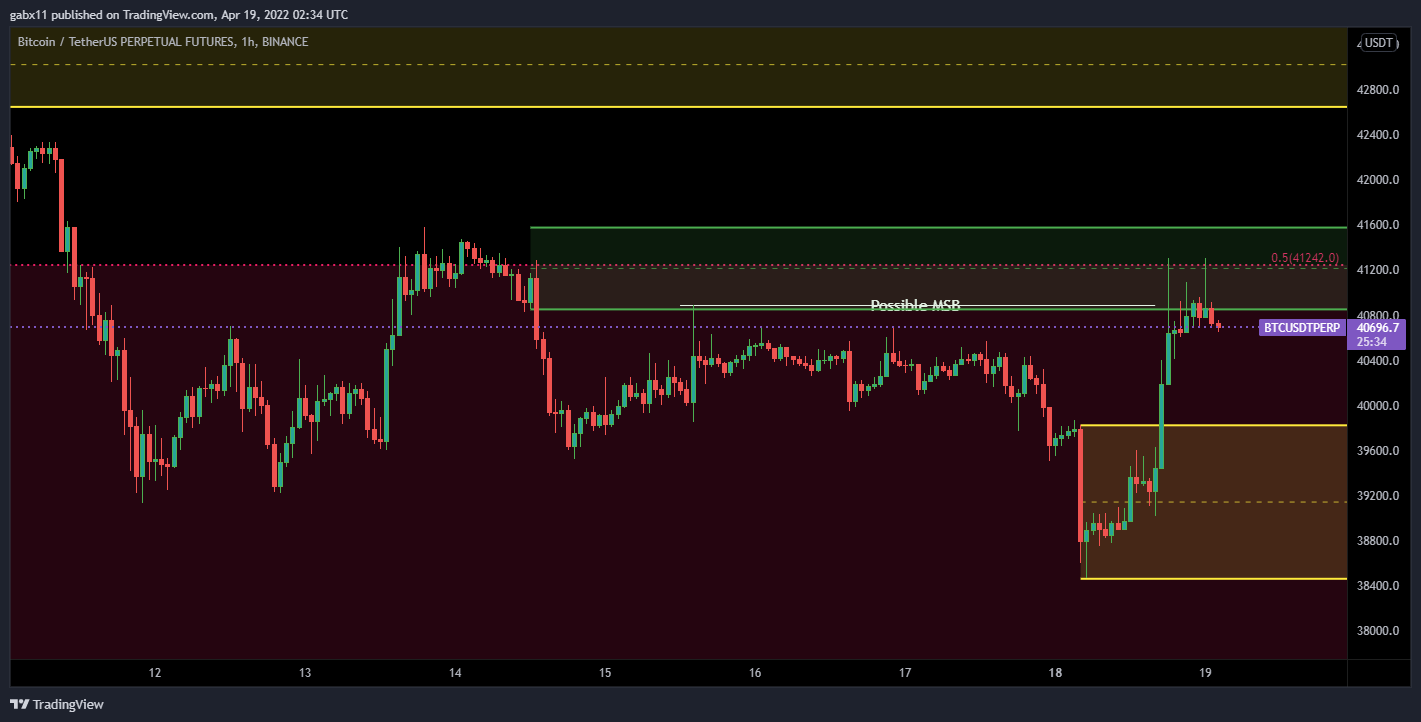
In the 1h timeframe, we can clearly see the structure serving as a supply zone that has been holding the price for now in the current rally (green box). This timeframe also had a bullish break so as mentioned in the paragraph above, I am expecting a mitigation of the yellow zone (4h demand), followed by a new leg up targeting the supply zones above.
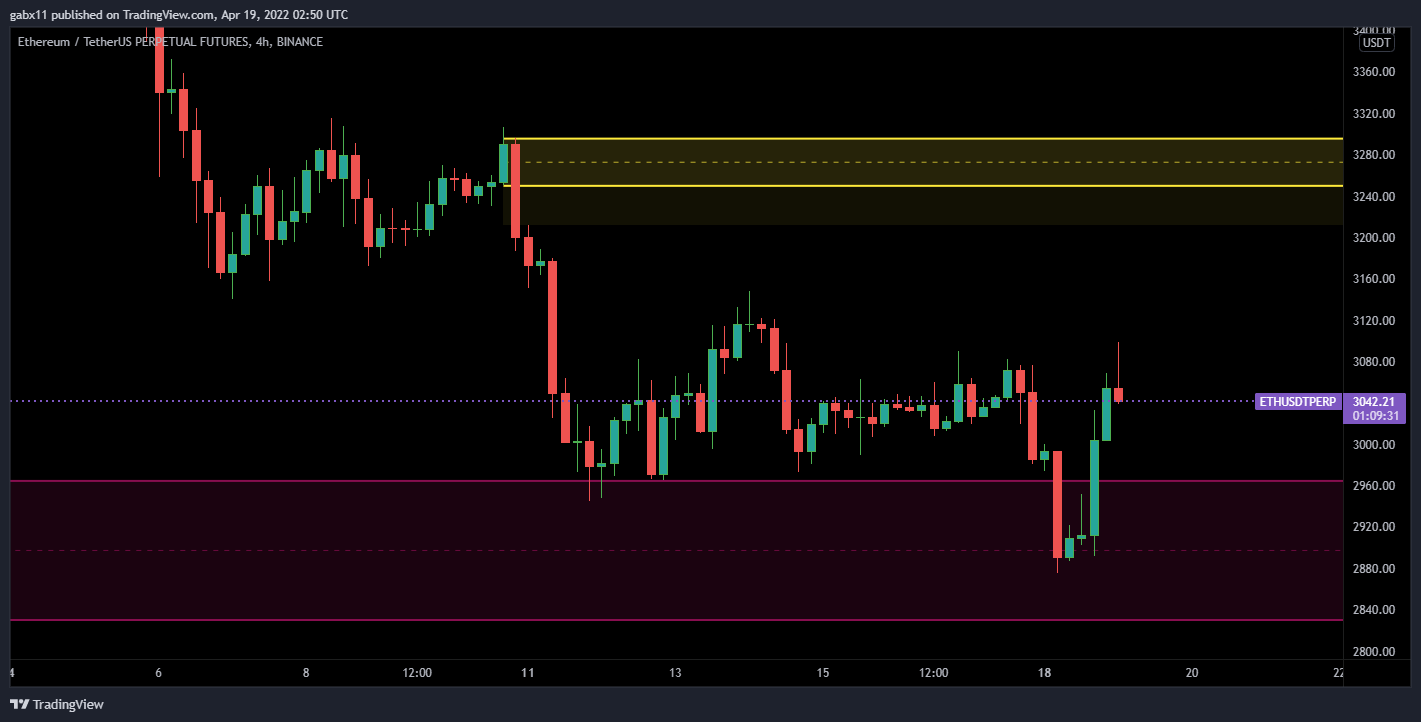
Now, I would like to share a top-down analysis of ETH.
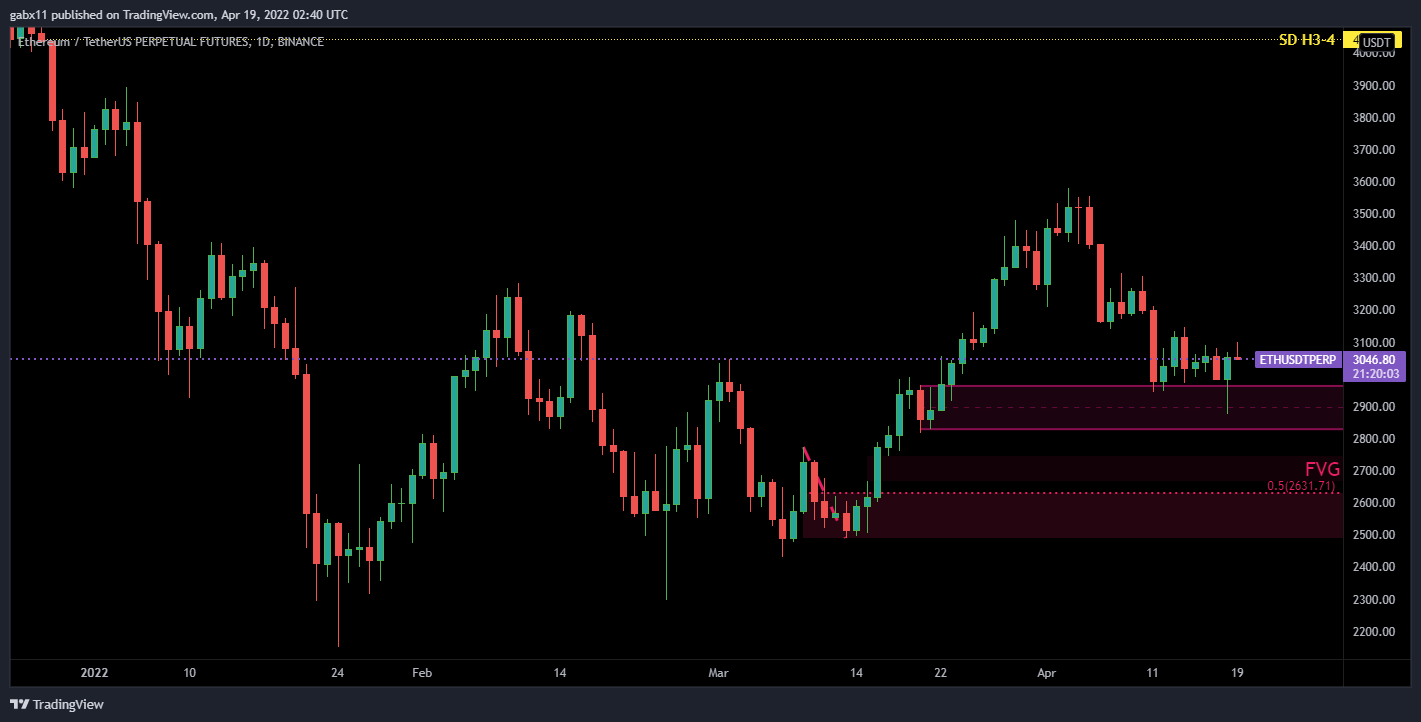
Right now, ETH seems to be mitigating the last down daily candle before the huge rally up that broke several swings high from the past. However, below this potential demand zone, there is an FVG, which can act as a magnet for the price, and below it, there is the swing low from the entire bullish leg of recent weeks.
Therefore, I am not sure if the current demand zone is capable of holding the price. The way this structure was developed, makes me think of a quick move down to mitigate the FVG and possibly even the impulse block below it could be expected. If it happens, it is my opinion it would probably be a fast and violent move down followed by an opposite move.
However, it is important to remember crypto prices are usually correlated, and BTC's structure is different because it didn't leave a daily untapped FVG.
FVG's aren't always tapped though, but it is important to have them in mind in case a violent move happens, because if it does, it might simply be a mitigation of that zone with the possible goal of following it with a continuation of the given structure.
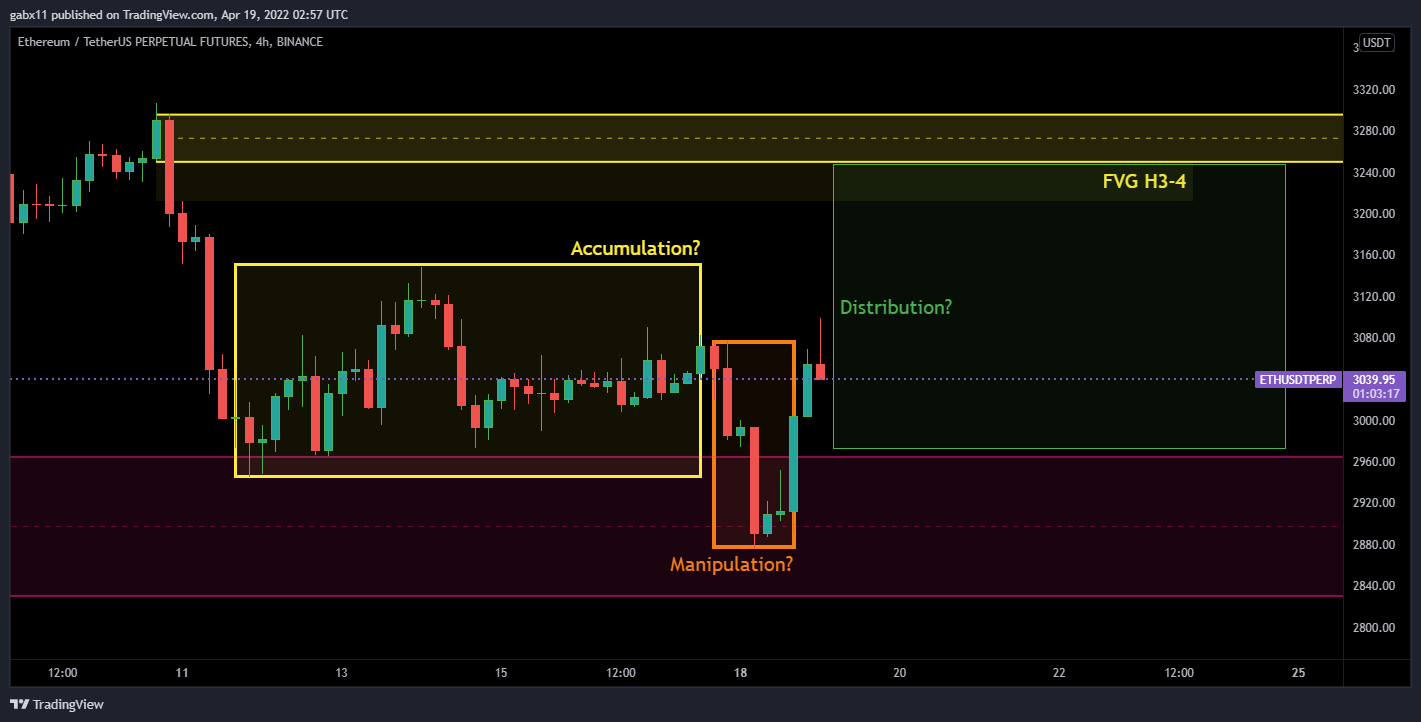
ETH's 4h structure hasn't decisively broken bullish yet, especially with that bearish-looking candle at the time of writing. Nevertheless, if you have studied the ICT concept called the power of 3, we might be currently undergoing the manipulation phase.
The power of 3 is a process involving 3 steps: accumulation, manipulation, and distribution. In the image below, I share how I would see this concept being applied to the current ETH's 4h structure. I guess in the next couple of days I would be able to confirm if this view was correct or not.
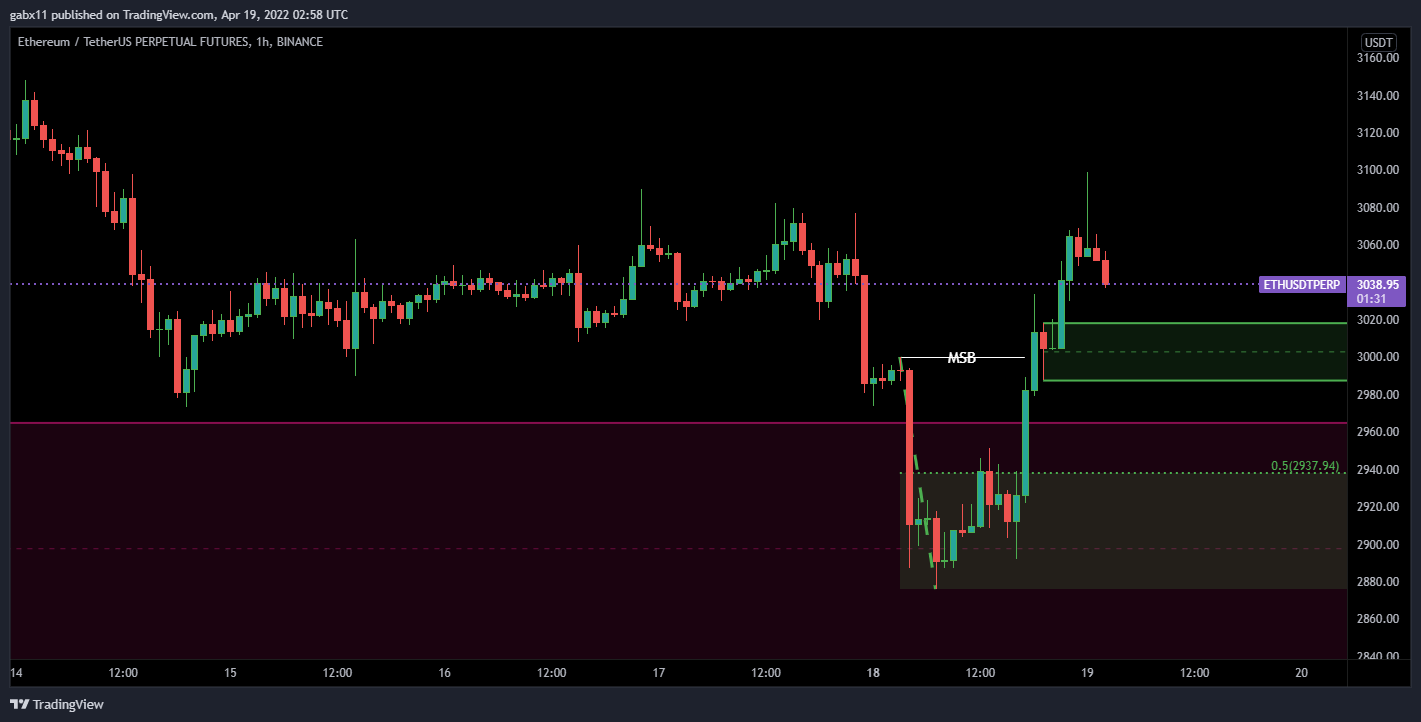
Finally, in the image below I share how I am viewing ETH's 1h structure. It did have a bullish market structure break, and below the current price we can see a very close possible demand zone, and down below close to the structural swing low, I included the bullish impulse block. That, coupled with the daily demand zone (red zone), should hold enough weight to keep the price in a bullish structure in the higher time frames.
In conclusion, I view the current prices of these 2 cryptos as bullish on higher timeframes, with mitigations going on on lower timeframes. In the case of ETH, a possible PO3 (Power of 3) might be taking place.
I would love to read the different opinions and analyses of this community and I am sure we can learn a thing or 2 from each other. Also, please feel free to comment or provide me with constructive criticism regarding the analysis I just shared in this post.

About Dedicatedguy
I am a Venezuelan geek, cinephile and introverted guy. I have always been passionate about tech innovations as well as creative fictional stories that can make your mind inhabit another world.
Writing about various topics, learning about the ever-expanding crypto world, and doing a little bit of trading is how I spend most of my days. My preferred forms of entertainment are films, series, European football, and a good book from time to time.
I chose "dedicatedguy" as my username to constantly remind myself about the importance of consistency and dedication in order to achieve any desired result we might want in life.
If this post provided something of value to you, any type of positive interaction such as a comment, reblog, or upvote is highly appreciated. ❤️

Posted Using LeoFinance Beta