
Direct from the desk of Dane Williams,
exclusive to leofinance.io
Key Takeaways:
- AUD/USD breakout follows through to daily resistance.
- While the market looks toppish, the trend remains bullish.
- Bias shifts to trade from the short side, as long as resistance holds.
AUD/USD Technical Analysis
The last time we spoke about the pair, AUD/USD had broken out of an intraday descending triangle.
While this pattern is one of the most high probability patterns found in the technical analysis of markets, the problem was that price broke out to the upside rather than the down.
I saw this as a problem because as price had broken on momentum through nothing more than an intraday trend line, there was no obvious price to place my stop that would see me truly get direction wrong if it was hit.
For this reason, I let the trade go.
Do I regret this decision?
Well, let's take a look at the updated Aussie daily chart below.
AUD/USD Daily:

While I certainly will never regret choosing to conservatively manage my risk as a day trader, it doesn't mean that I don't get frustrated as all hell watching breakouts that I identify early, but don't trade.
Point in case that bloody triangle on the Aussie.
But will you look at that.
Barely a week after the missed triangle breakout, price has already moved back to retest our daily resistance zone at 78c.
That's the thing about day trading forex markets.
You may miss one trade, but your frustration never lasts long because there will always be another trade.
In this case, a potential AUD/USD short.
All we have to do is see the Aussie hold resistance.
With that in mind, let's zoom into an hourly chart and take a look at what the price action has on offer.
AUD/USD Hourly:
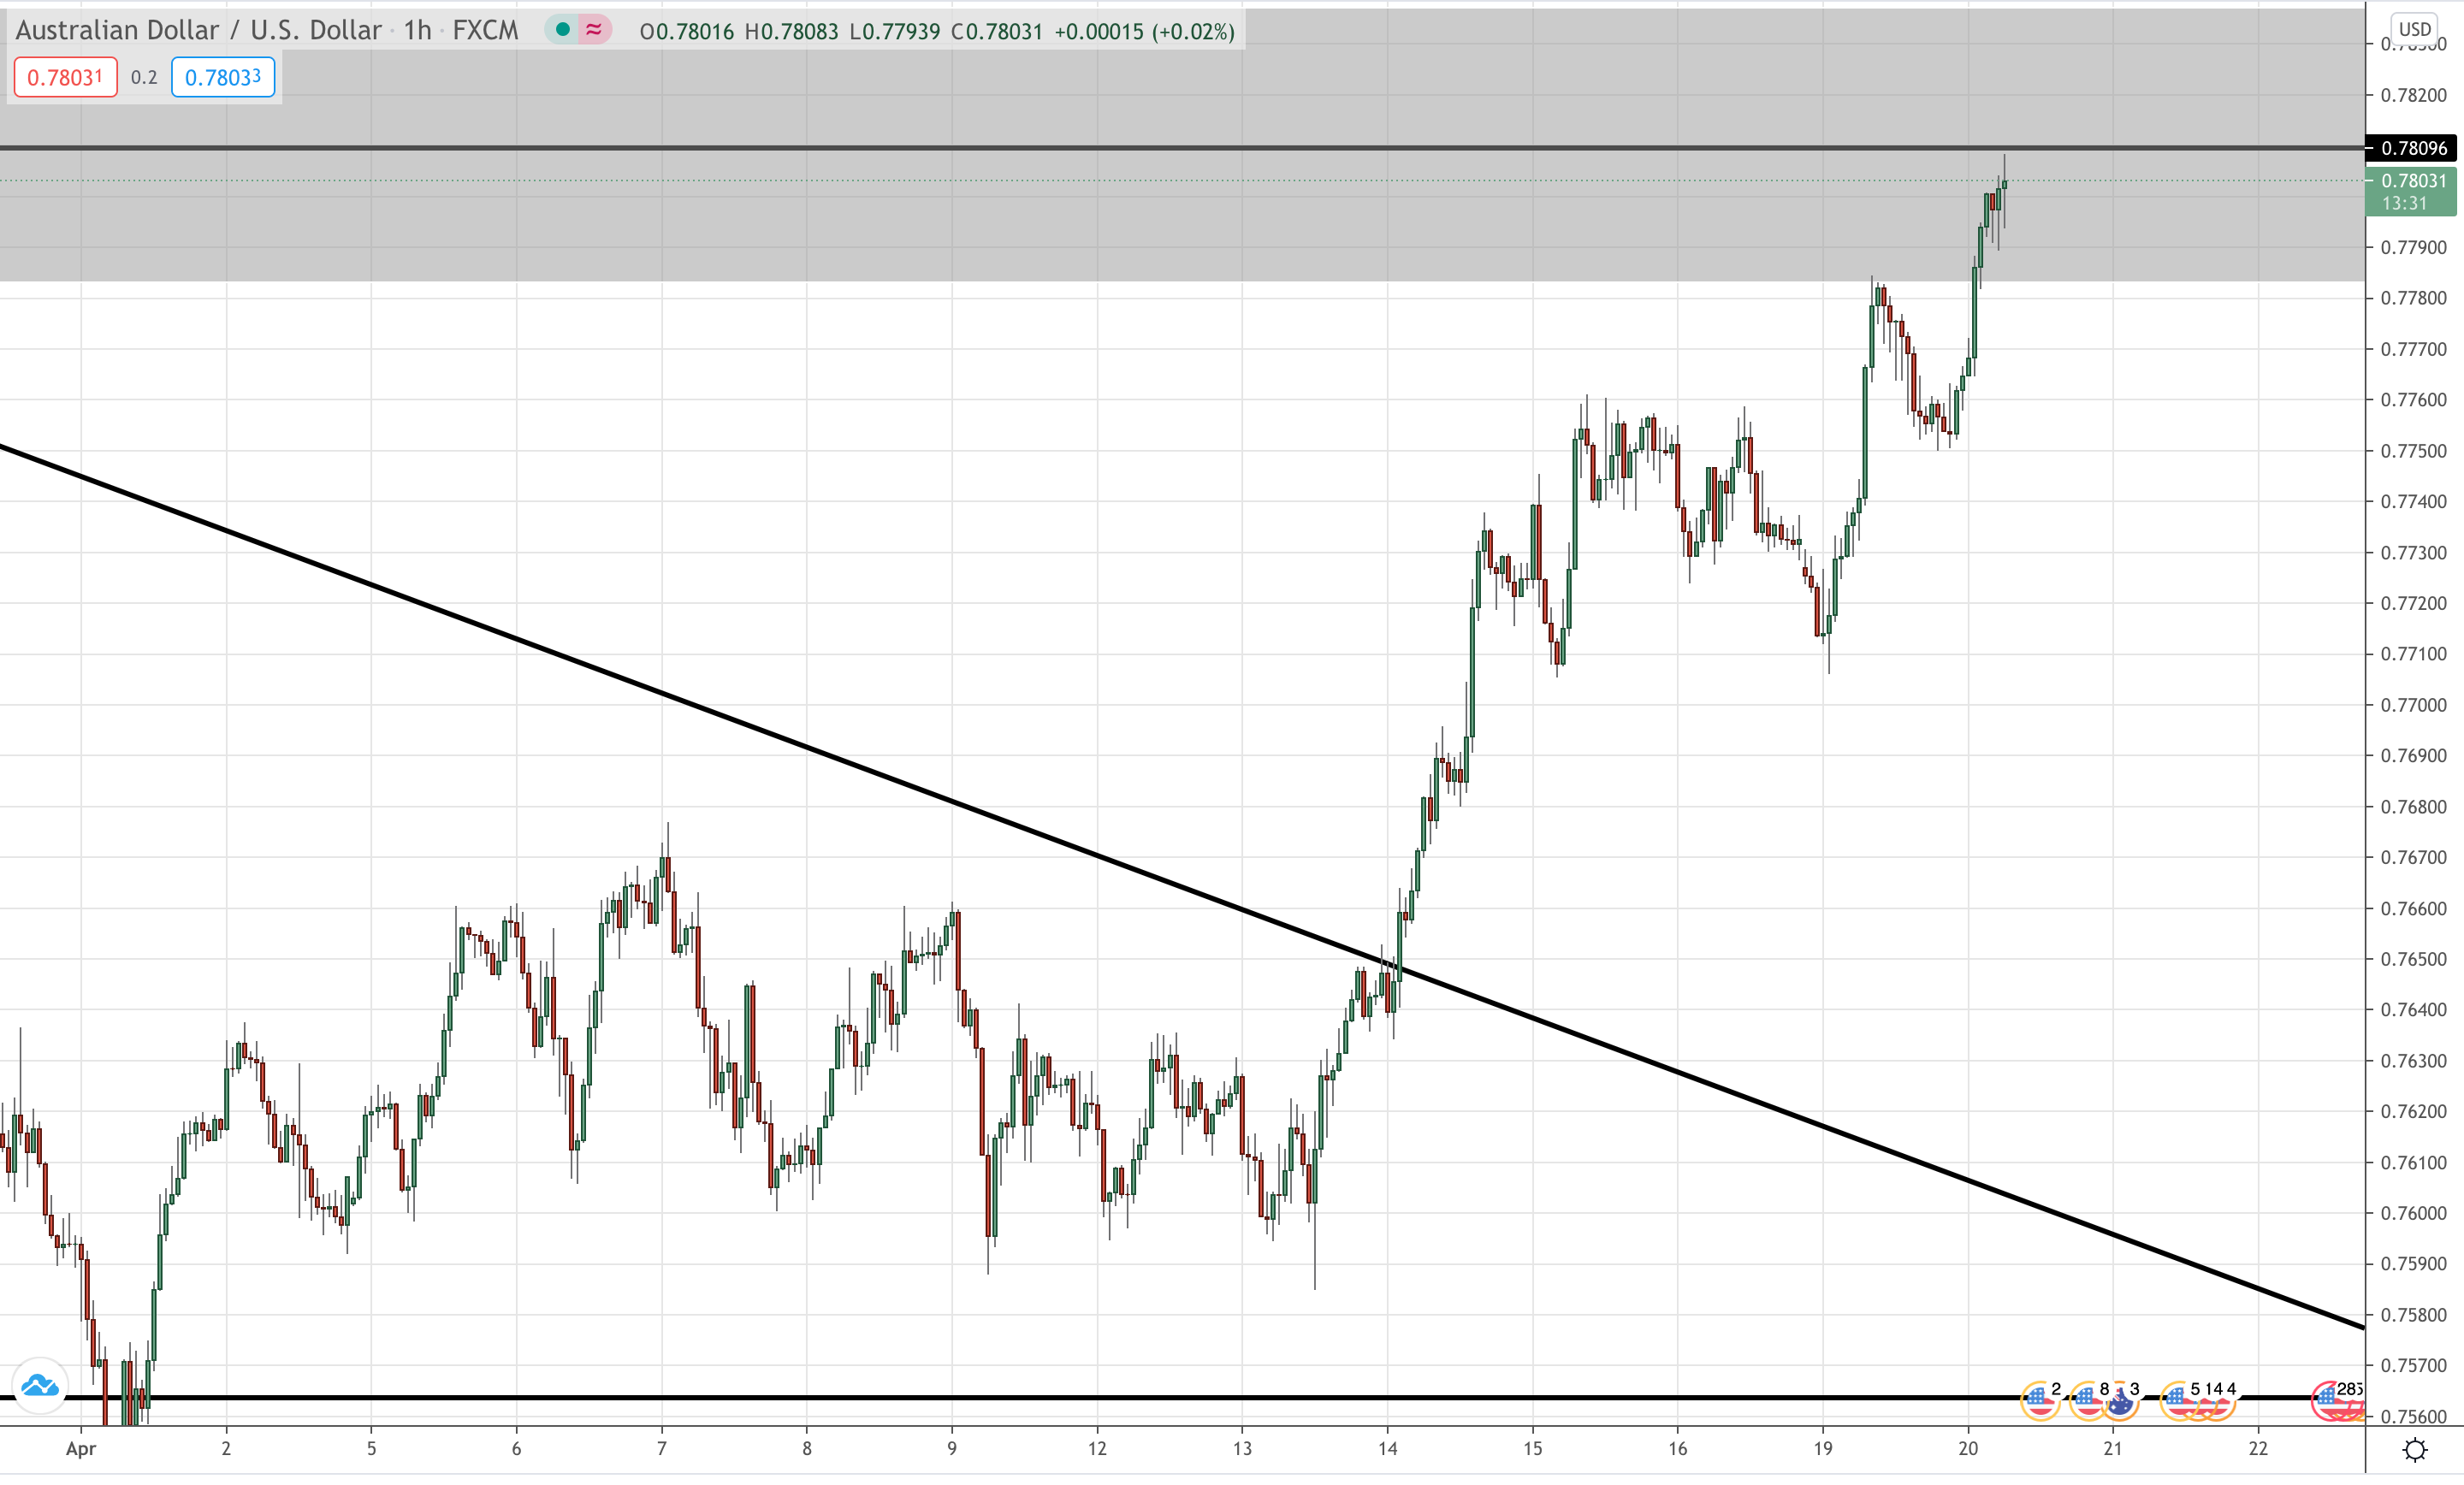
As we're still below higher time frame resistance, our bias right now is to look for short setups.
What we want to see here is for price to reject out of the the daily zone, before retesting a level of short term support as resistance on the hourly.
But also watching EUR/USD smash through resistance on its own daily chart, the USD is obviously weak right now and this zone on the Aussie could be in for a similar fate.
This is where my strategy is conservative and wants to see confirmation of that the daily zone has in fact held.
We do this by waiting for price to reject down outside the grey zone before any intraday retest can be used as an entry.
For now though, this one looks to be setting up quite nicely.
Best of probabilities to you.
Data to Watch This Week:
- Retail Sales m/m (AUD)
- Crude Oil Inventories (USD)
- Unemployment Claims (USD)
- Flash Manufacturing PMI (USD)
- Anzac Day Bank Holiday (AUD)
Why not leave a comment and share a chart of your own in the comments section below? All comments that add something to the discussion will be upvoted.
This daily market analysis blog is exclusive to leofinance.io.
Posted Using LeoFinance Beta
I just wait for the correction
Posted Using LeoFinance Beta
Manage your risk :)
Posted Using LeoFinance Beta
Surely it has to get back up over 80c with interest rates slashed in the US and Corona creating hell?? Sometimes you have to trust your own analysis!
Posted Using LeoFinance Beta
While those reasons are a good reason to think that the Aussie will go up long term, they don't help me make money day trading with a sub 50 pip stop loss.
A 100 pip pullback doesn't change the fundamentals you've listed, but it does stop me out of trades.
This is why taking trades at areas where that 100 pip pullback is the least likely, is so important for my long term profitability.
And for me, buying that triangle breakout was just too risky.
Frustrating looking back on it because it would have made money, but it was the right decision.
Posted Using LeoFinance Beta
And that is why I don't trade!
Posted Using LeoFinance Beta