
Direct from the desk of Dane Williams.
Exactly 2 weeks ago also on Sunday, we spoke about GBP/USD printing a double top at resistance
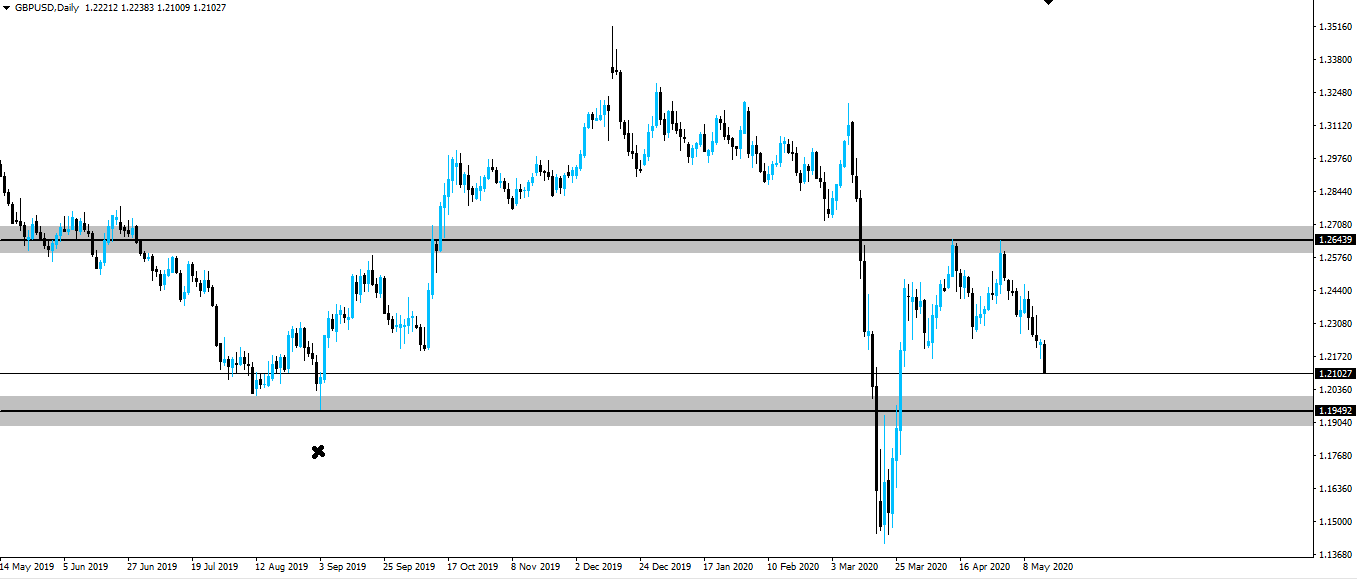
I haven't blogged about the pair since because my attention has been focused elsewhere, but take a look at the Cable daily chart now.
GBP/USD Daily:
You could have literally gone short anywhere and any time after price hit higher time frame resistance for that second time.
Pullbacks were all shallow and by zooming into an intraday chart like the hourly, you'll see that there were a ton of short term support turned resistance levels to manage your risk around.
Now looking forward to next week, I've marked that September 2019 swing low as a possible support/resistance zone to keep an eye on as price comes back down.
While priced smashed through it on the way back up, you can see that it did respect the zone on the first retest and I expect some sort of reaction at the zone once again.
Good job to anyone who got short GBP/USD!
Best of probabilities to you,
Dane.
FOREX BROKR | Hive Blog
Higher time frame market analysis.
Posted Using LeoFinance