One of the benefits of web3 system is information storage capacity for future reference. This article summarizes a descriptive analysis of POLYCUB and DOGE prices in the month of October, 2022.
It shall be considered under the following subheadings;
Line Graph of POLYCUB and DOGE price.
Boxplot of POLYCUB and DOGE price.
Correlation analysis of POLYCUB and DOGE price.
Maximum and Minimum prices of Both Assets.
Conclusion
Line Graph of POLYCUB And DOGE price
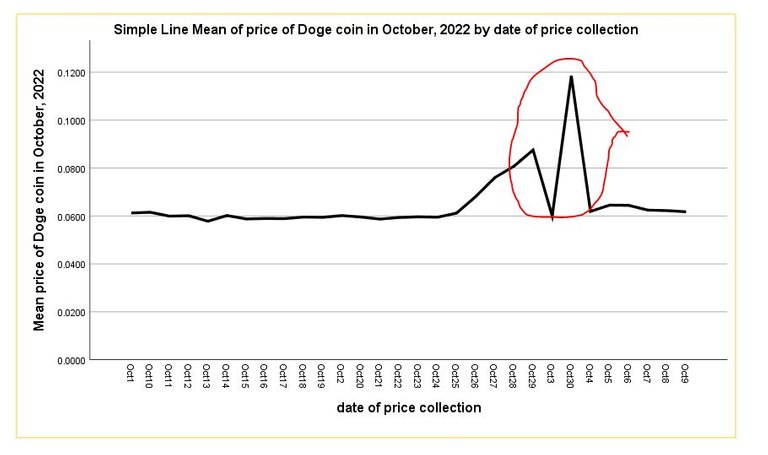
The image below represents the line graph of DOGE coin. There was an unusual shoot in the price of DOGE as seen in the image below. Details of this will be displayed in the boxplot diagram.
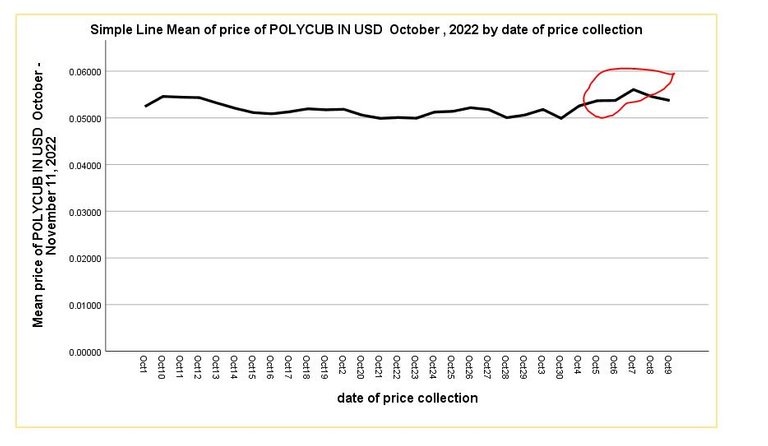
The image below represents the line graph of POLYCUB price. It is visible that during the early week of October, there was a little pump in the price of POLYCUB.
Boxplot of POLYCUB and DOGE price
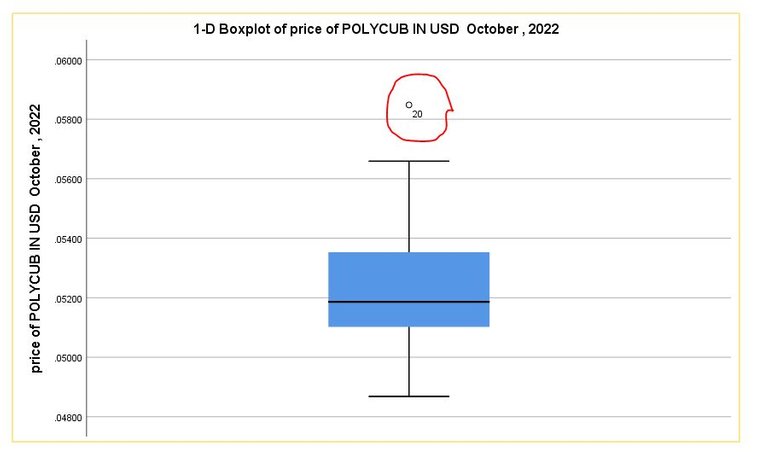
The boxplot of POLYCUB is extended information of its line graph price as seen in the image below. It only had one unusual pump in its price in the month of October, 2022. Other entered price is normal.
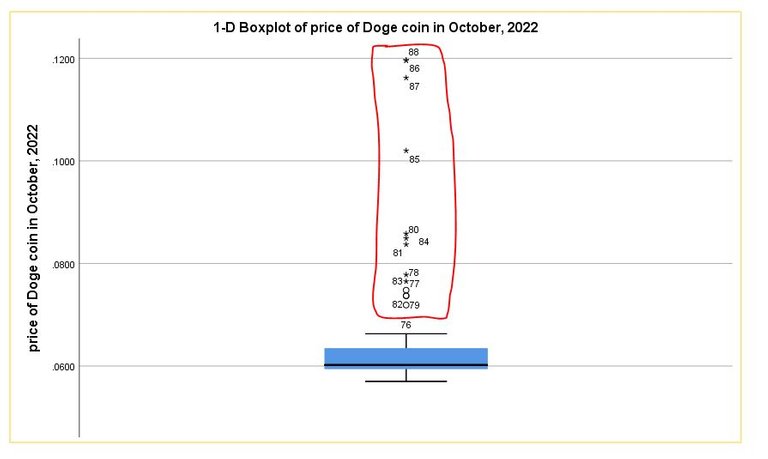
The boxplot of DOGE can also be seen in the diagram below. It shows an unusual figure from the normal in the price of DOGE in October, 2022 above $0.12.
Correlation analysis of POLYCUB and DOGE price
In an analysis of correlation, there seem to be a weak negative relationship with a coefficient of 0.316.
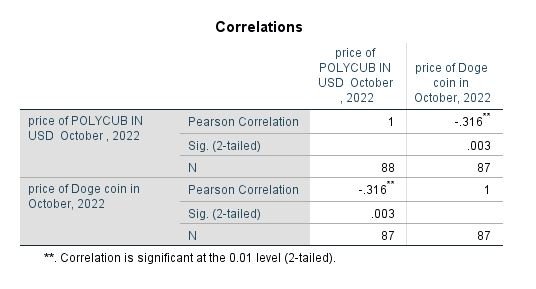
However in is not advisable to invest in both asset simultaneously.
A negative correlation indicates as the price of DOGE pumps, that of POLYCUB experiences a dump and vice versa.
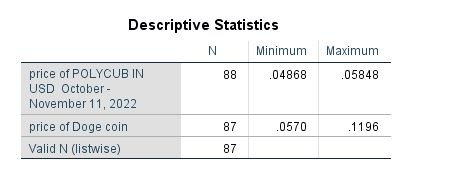
Maximum and Minimum prices of Both Assets
The maximum and minimum price of both asset is been represented in the table below.
Conclusion
This article has been able to present a descriptive analysis of DOGE and POLYCUB. It has shown that there was a shoot in the price of DOGE above the normal. The article also presents the maximum and minimum prices with analysis of correlation.
Posted Using LeoFinance Beta