BTC 1D chart
Hello guys :)
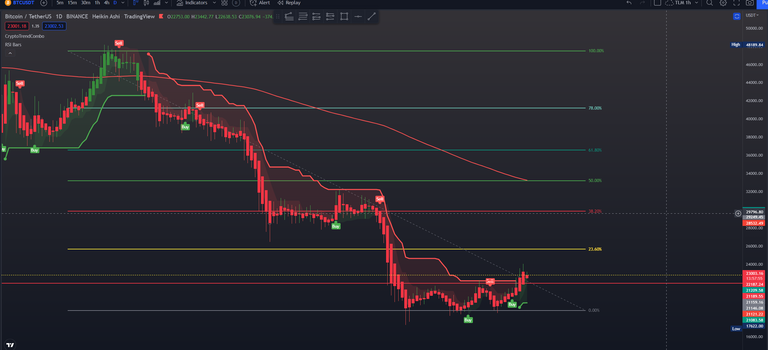
Today we will review the BTC / USDT 1D chart.
As we can see the bears are still not gone yet, even if we had a pretty good bull run last week.
It was not something not expected, as you can see in my last post with TA.
We did some pretty good profit thanks to the m&m indicator, which we are using on a daily base.
From last " Buy " signal we gather almost 13% profit for 4days period.
----------------------------------------Further expectation------------------------------------
We really want to see the price hitting the "yellow" level of Fibonacci and in case of a break out, 30k better holds your pants.
Most realistic case for me is to see the price taking some pullback after reaching the Fibonacci level of resistance.
Follow me for more technical analysis.
For buying the indicator for accurate buy / sell signals please write me down to [email protected]
The fun part of this post is to share some results during the last week :)