Welcome to the monthly edition of LeoFinance stats. This will be a monthly edition of the stats, since a lot of things have happened this month and the weekly stats were delayed.
A HardFork on the Steem blockchain creating Hive, ergo rebranding from Steemleo to LeoFinance. Read more about this here Introducing LeoFinance | Major Updates to the SteemLeo Community Since the Hive HardFork
If you want to know a bit more about the LeoFinance platform and dig into the numbers, this is the place to be.

The following topics will be covered:
- Issued LEO Tokens
- Top LEO Earners
- Rewards to SP delegators trough the leo.bounties program
- Daily stats on tokens staking
- Share of tokens staked
- Top Users that staked
- Daily stats on tokens burned
- Number of Steemleo users
- Posts and comments activities on the platform
- Posting from Steemleo.com inteface
- Votes from the @leo.voter account
- Price Chart
Issued LEO Tokens
Let’s take a look into token distribution, inflation and how it is distributed.
Below is a chart that represents the cumulative issued LEO token.
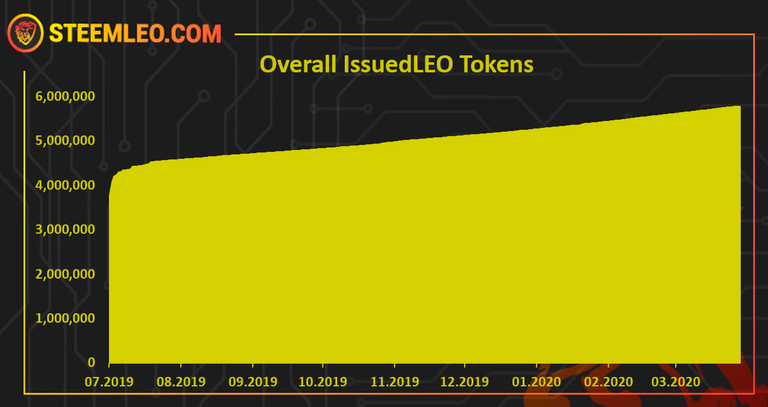
A total of 5.8 M issued LEO tokens.
We can notice that the LEO token doesn’t have a large inflation compared the base supply and its slowly increasing its supply. Note that burnings are not taken into consideration in this chart. That will be presented below.
Next the issued LEO tokens from last month. Here is the chart.
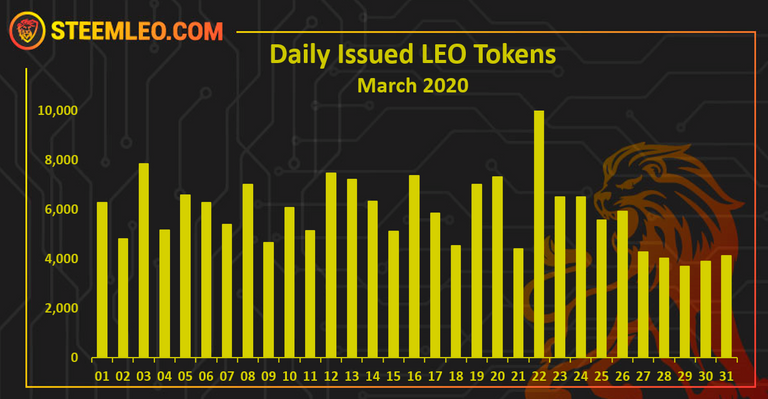
On average 5.8k LEO tokens were issue daily in the last month with a total of 182k tokens issued. We can notice a drop in the issued tokens at the end of the month since Steem Engine was having a technical issues after the hardfork, and the steemleo LeoFinance frontend as well.
Let’s see how these tokens were distributed.
Below is the chart of the top 10 LEO earners in the month.
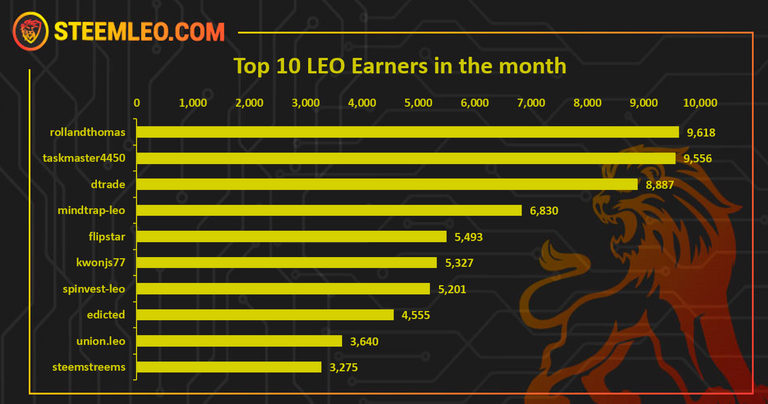
@rollandthomas is on the first place followed by @taskmaster4450 and @dtrade on the third place.
Note: The @leo.bounties account is excluded from the list above. Bellow, is a separated data on the tokens transferred from @leo.bounties to the delegators. A total of 21000 LEO tokens were issued to the @leo.bounties account in the last month.
Reward to SP delegators [Bounties]
The LEO platform has a reward mechanism for SP delegators to the @leo.voter account. Users who delegate their SP to the @leo.voter receive daily LEO tokens. The amount of LEO tokens depends on the LEO price.
Having more SP to the @leo.voter account provides incentive to users to use the platform and grow the userbase.
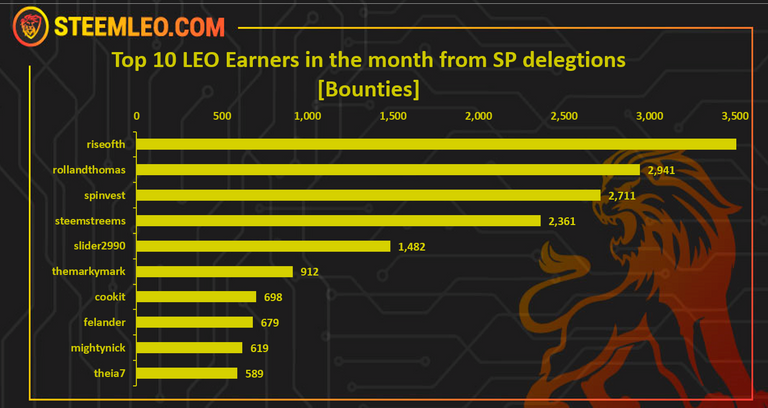
The account @riseohth is on the top of the list, next is @rollandthomas followed by @spinvest.
A total of 22903 LEO was rewarded to SP delegators in the last month.
Staking LEO
Below is a chart that represents the daily movement of staking/unstaking of the LEO token.
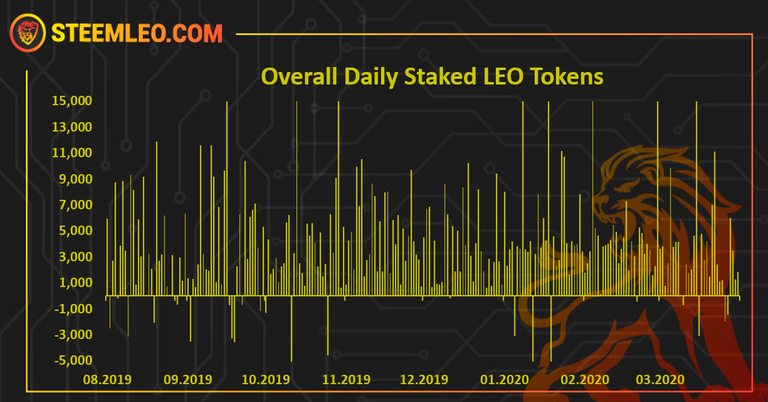
July 2019 is excluded from the chart for better visibility. Those are the first days and there are a lot of tokens staked.
Let’s take a closer look to the last month.
The chart for the last month looks like this.
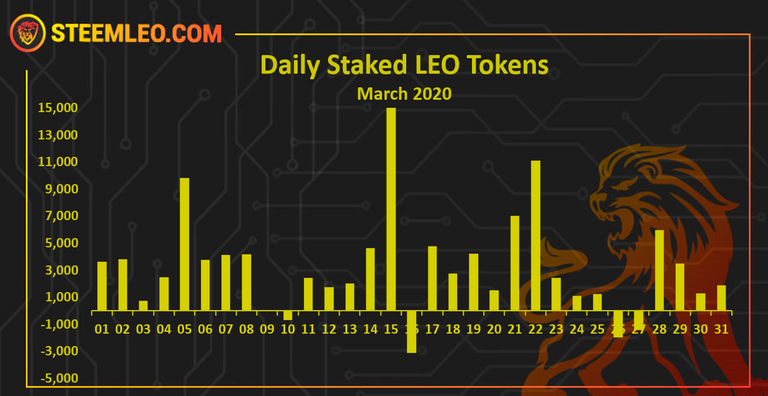
The leo staking stats were great in the previous period, but because of the HardFork a lot of users were exiting all the SE tokens in general and were trying to get more STEEM to be eligible for the HIVE airdrop. This caused more unstaking to appear. Still a lot more days in positive than in negative.
Here is the table.
| Monthly Data | LEO |
|---|---|
| Staked | 199,984 |
| Unstaked | 97,947 |
| Diference | 102,036 |
A total of **102,036 ** more LEO tokens staked last month. But we can notice that almost 100k LEO are untaked as well.
Below is the chart of the top 10 users that staked last month.
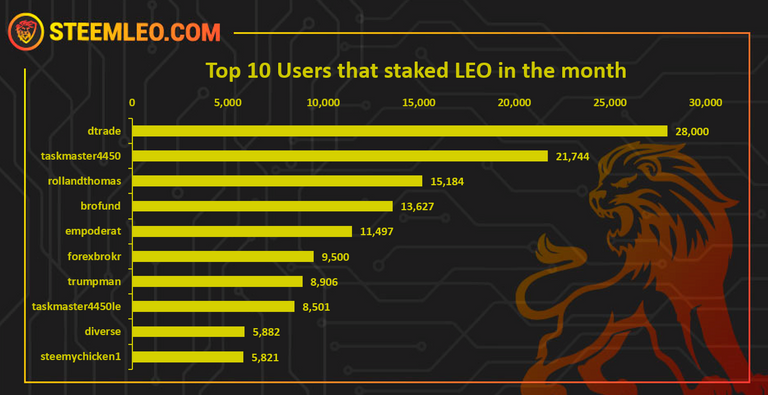
@dtrade on the top with 28k LEO staked, followed by @taskmaster with 21k and @rollandthomas.
Here is the overall chart on LEO tokens supply.
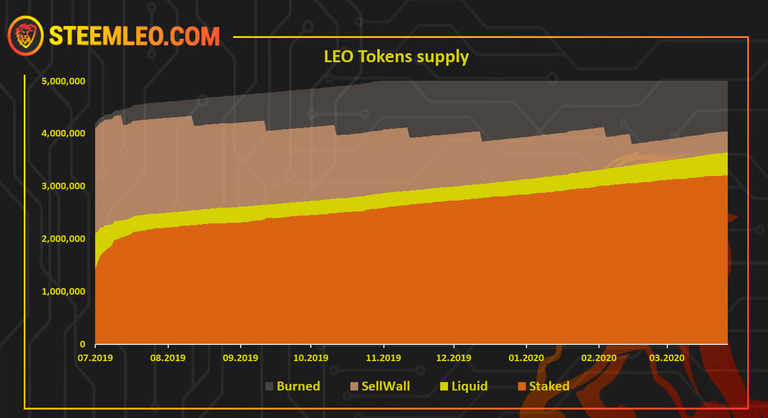
We can see that the staking is increasing over time, the liquid supply is going down. The burnt tokens also are taking a bigger share with the monthly burns from the sell wall, showing the big drops.
Below is a chart of the ratio staked/unstaked tokens, excluding the tokens reserved for burning (sell wall), at the moment with around 0.4 M tokens.
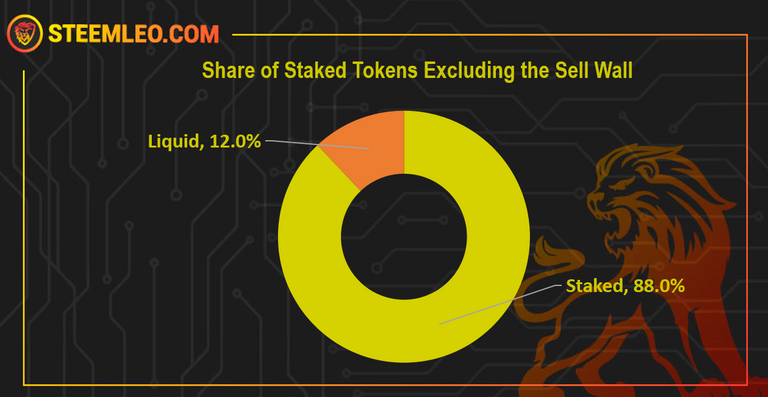
The share of the staked LEO for a long time was around 90%, and with the recent events it has dropped but only by 2%, to 88% staked LEO.
Out of the current supply 4 M tokens, 3.2 M are staked, 0.4 M are set to burn and 0,44 M are liquid.
Burning LEO
Burning tokens is an important metric as in a way it is a anti inflationary measure and it shows the use cases for the token or sinks. LEO is having huge regular monthly burn and also all the burns that comes out of its sinks.
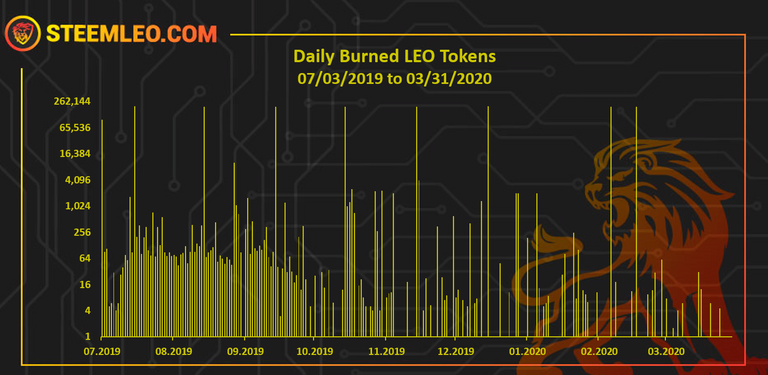
The vertical Y axis is on a logarithmic scale for better readability.
The large share of the burned tokens 1.7 M tokens is due to sell wall burn. The rest of 56k tokens are from the sinks for the LEO token.
The LEODEX is bringing more burns lately for the exchange listing fee of 2000 LEO per token.
The LEO shop will also make burns from the selling fees.
Steemleo Users
Below is a chart with the number of unique users that posted on Steemleo frontend.
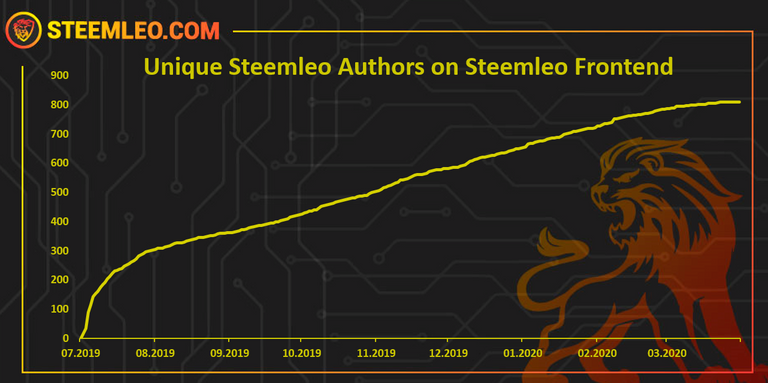
A total of 810 unique user have posted from the Steemleo frontend.
Activities on Steemleo
Below is a chart of the Steemleo activities, including posting and commenting from the Steemleo interface and posting and commenting with the Steemleo tag.
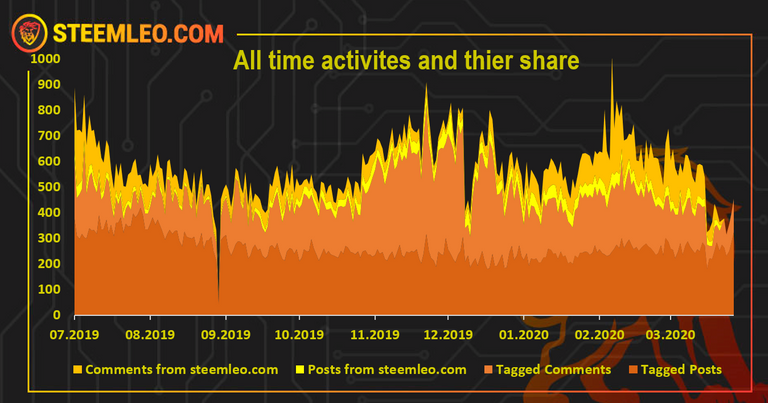
As already mentioned after the HardFrok, Steem Engine was experiencing technical issues, and the steemleo frontend as well. Because of this at the end of the month there is less activities coming from the frontend.
Here is the chart only for posts from steemleo.com interface.
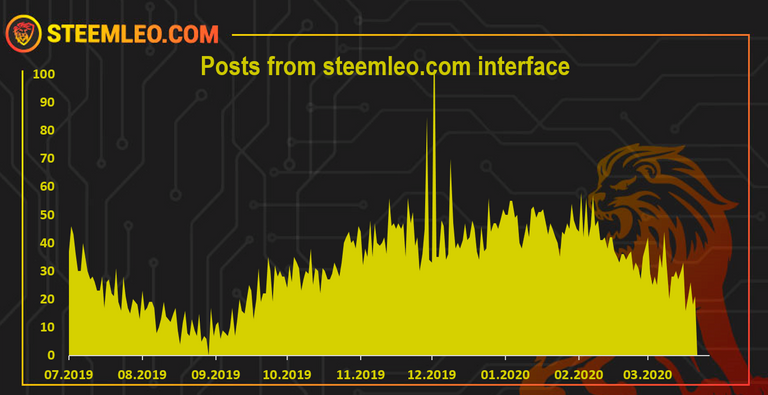
The stated above can be noticed even more on this chart.
Votes from @leo.voter
The @leo.voter account is being converted from a bot to a rewarding accounts to users who use the Steemleo.com interface. Here is the chart.
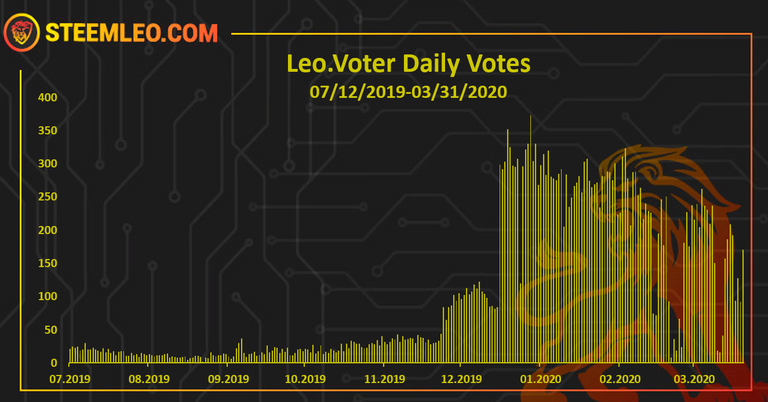
We can see that there is increase in the voting since now it’s being used to reward users who use the Steemleo interface.
More than 22k STEEM overall rewarded to authors from the leo.voter till this date.
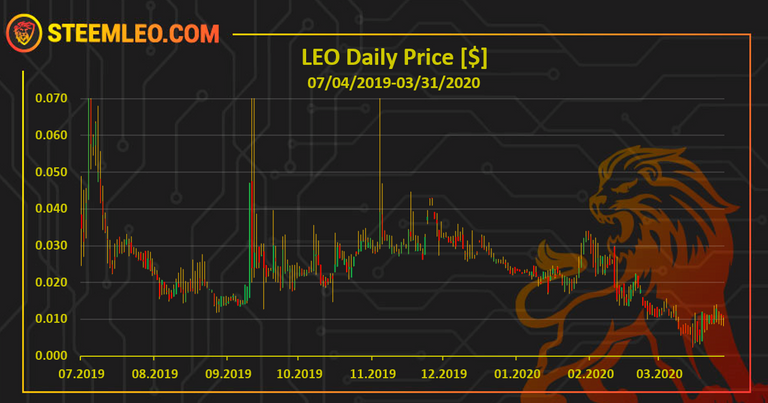
Price
All time LEO price
Here is the price chart in dollar value with proper daily candles.
Last 30 days LEO price
Here is the price in the last 30 days also in dollar value.
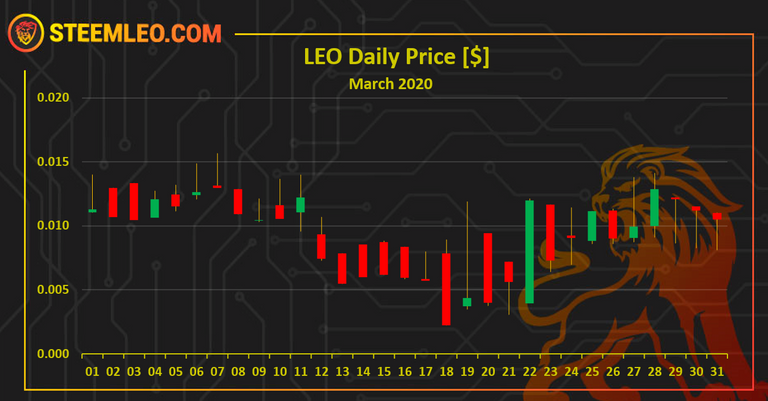
The LEO token as all the SE tokens has taken a hit because of the users trying to get more STEEM before the HardFork and get more HIVE from the airdrop. But it still managed to contain some of its value.
Looking forward for a new chapter for LeoFinance and HIVE!
#steemleo - A Next-Generation Community for Investors

Report by @dalz
Thanks for the stats.
Look forward to how these numbers change now that we are on the Hive Blockchain.