Author: @madridbg, through Power Point 2010, using public domain images. tradingview
Greetings dear Hivers.
The topic that concerns us in this installment is of an economic nature and is associated with the technical understanding of the price action of the different commercial assets in the world of cryptocurrencies.
In this sense, it is necessary to highlight that the experience in trading in many cases is more important than the approach or conceptual learning of a financial instrument or indicator, where the operations associated with profits and Losses are those that in the long run will give us the constancy in the operations that we carry out.

Based on the above, technical analysis and the knowledge associated with it is still important, on the contrary, knowing and understanding the price action based on these allows generating greater capitalization and effectiveness in our operations, so it is necessary to learn the importance of temporalities, the wave direction of the price, as well as the direction of the trend and the important trading zones that many analysts consider as support and resistance zones.
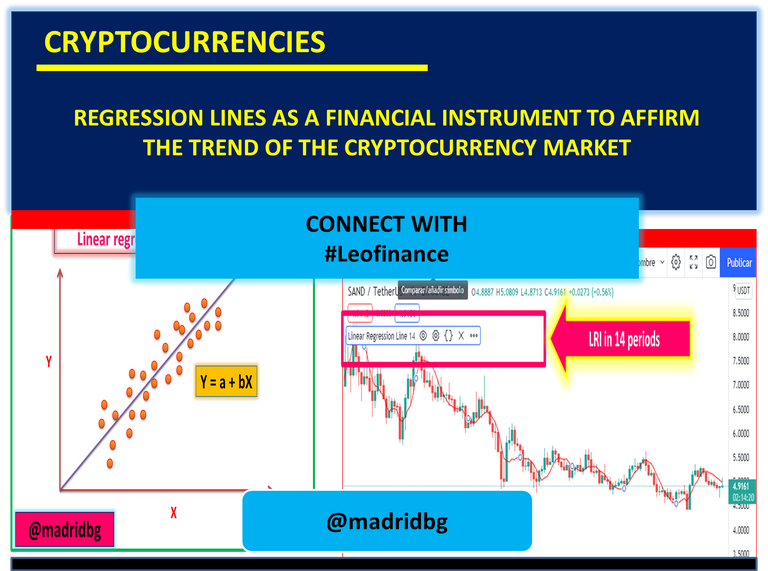
Therefore, the approach of this writing will focus on understanding the linear regression method as a financial instrument that allows identifying, confirming and evaluating the changes in trend that occur in the price of a active. In this sense, a linear regression is a statistical slope that follows the behavior of the dispersion diagrams, so that it moves in a straight line through the price points closest to normality or daily values of the asset.

Therefore, the scattered points are considered as abnormal moments within the asset, and these values are generally not taken into the calculation, hence the instrument has the ability to follow close to the price action, behavior that makes the indicator more accurate and therefore so used to identify trend changes and future projections in price action.
Starting from the above, we will study what concerns the regression line based on the affirmation of the trend and to detect this type of behavior we will rely on the daily time chart for the BNB pair /USDT.
If we analyze the graph below we can see that observation is enough to confirm and affirm the trend and the location of the regression line facilitates this work, so that if the price action If it is below the regression line, it is an indication that the trend is up and that the buying pressure exceeds the selling pressure, at this point, the price should be developing higher and higher lows and highs, which is confirmed by the positive slope assumed by the regression line.

Screenshot taken by @madridbg through the tradingview portal. tradingview
On the other hand, when the price action moves above the price action, we can infer that the trend is bearish, which we can confirm with the formation of the negative slope assumed by the regression lines studied.
Aspects that we can identify in the chart for the ETH/USDT pair on a daily basis that is presented below, in it we can detect that the price has been showing increasingly lower highs and lows which is another conformation that we can detect using the regression line.

Screenshot taken by @madridbg through the tradingview portal. tradingview
As we can see, the regression line is very easy to use to affirm the trend of an asset, therefore, in future publications we will be addressing how to identify support and resistance zones, as well as the reversals produced in the generated trends.
OF INTEREST

Posted Using LeoFinance Beta