I think I'm enjoying sharing my Bitcoin analysis with you. In a previous post on the 23rd of March I gave some clues of the possible movements of this asset, before the end of the month, just based on volume and some simple indicators that I use.
So... 😅 now we have a cover. We can do this at the beginning of the month and before the end of the month, right?
Let's remember:
After pointing this out in that post you can see here, I said:
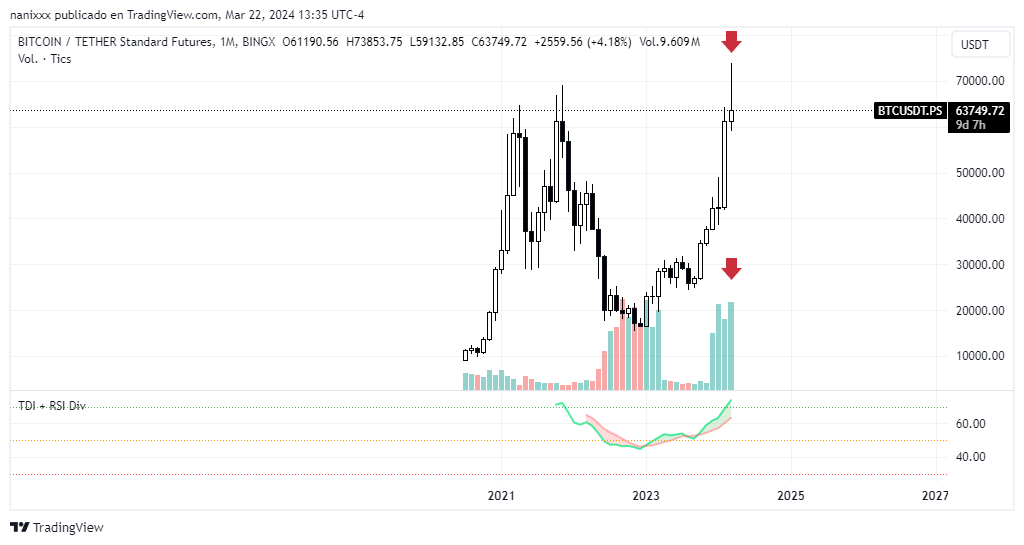
...the market tells me that there is a lot of volume and a small body for that candle, so BTC is likely to see new highs in the coming months.
Then I added:
(You can go check that post before continuing with this one, but let's see what happened and what is happening right now.)
The last few days of the month were a time of growth for the thin candle I was pointing to. This is very important to note, if you want to learn to read the market. The trading volume represented by the bar below was not in line with the body of that candle. So, exactly what the market was announcing happened, buying. Then you can see that the March candle closed with a little more body. However, it still did not match the volume below.
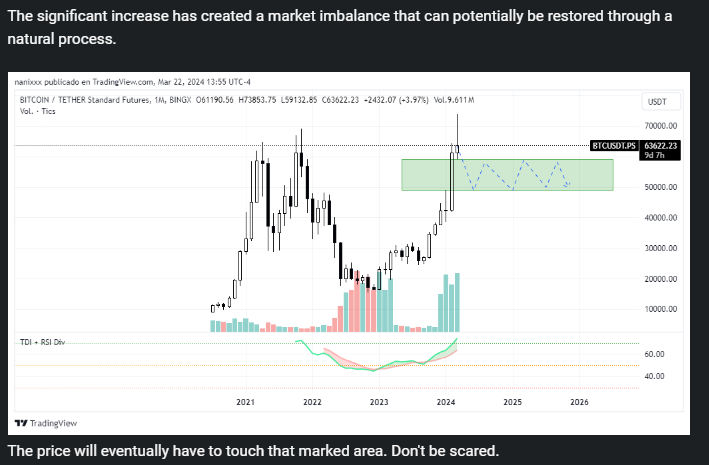
This discrepancy opened a monthly candle that looks (for the moment) bearish. It is expected, as I explained, that the large imbalance that caused the rise and its liquidity void will be filled or corrected, and then continue to rise.
We are in a monthly timeframe. Let's look at the daily and also keep an eye on the divergences.
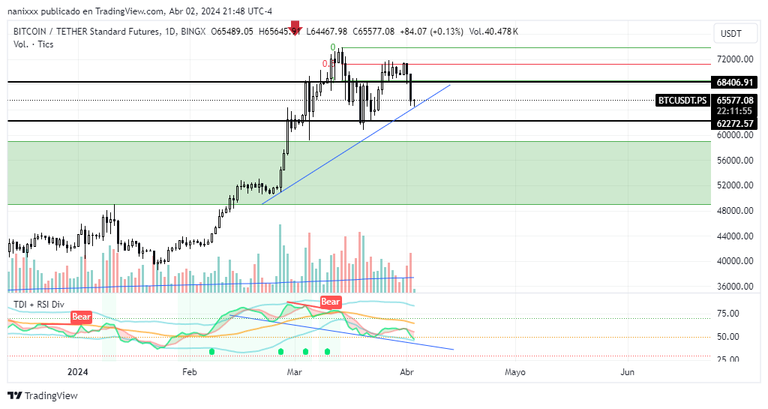
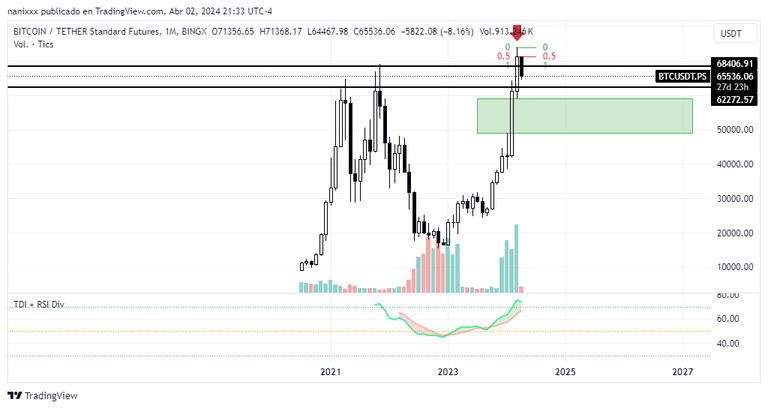
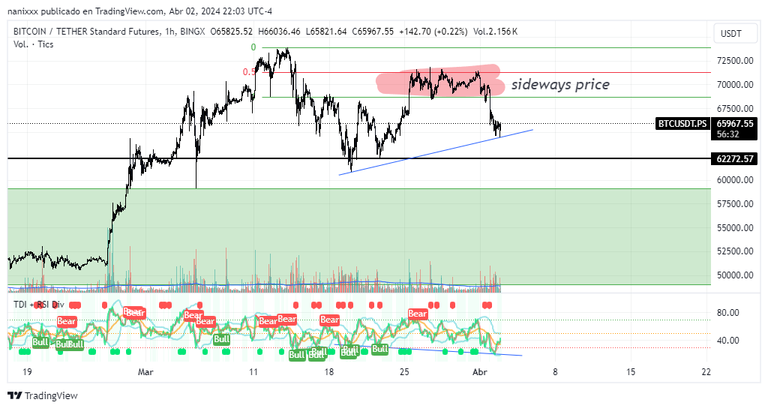
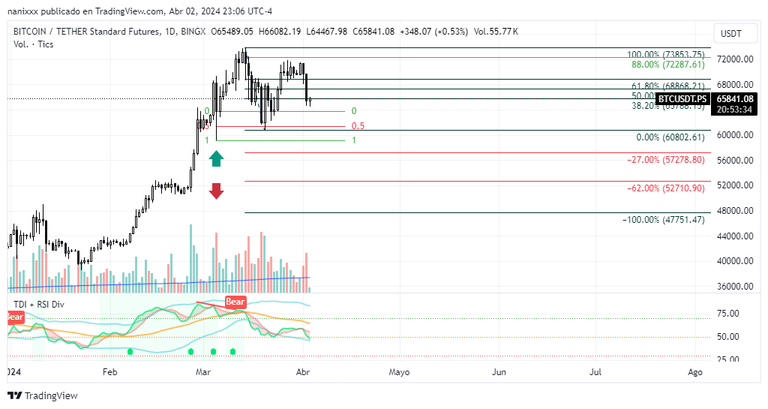
Between 71300 and 71800 there is a very strong resistance which the price could not break. There seems to be a selling consensus where the price has been sideways for a while, but you can see this clearly if you look at the one hour chart.
Before I show you that image, look at the hidden divergence between the chart and my TDI indicator. I marked it with two trend lines. The price should fall until it corrects that divergence.
If you notice I have two black lines marked. This is an operative that I even shared in X.
Have a look at this thread:
In other words, I am now waiting for the second price to make another entry. I said I was not going to trade short because BTC is bullish and I prefer to take only buy trades now. I said this in the previous post.
But as I pointed out, there is nothing to worry about. This is a natural market process and although we could be down for two months, it does not mean that we will not go up again.
What I do is precisely to be attentive to volume, divergences and follow my trading plan.
Do you have a trading plan? I can share mine in detail in the next post.
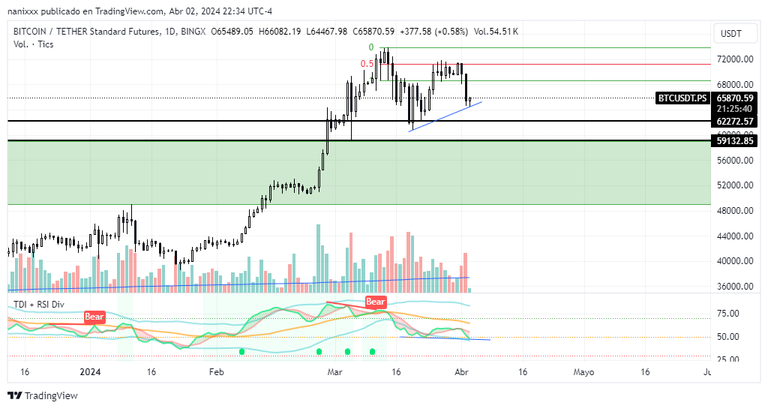
There has not been a change in the bullish structure here, this is a simple correction, so I see possible upward reactions in those prices I have marked in black.
(62272.57 and 59132.85)
When I talk about structure, I mean that the lows are getting higher and higher just as the highs are getting higher and higher. A change in trend would be lower highs and lower lows as well.
This is daily timeframe so a prediction here may take two or three weeks to occur, even longer.
That upward reaction zone has already been tested and held, but will it make it a second time?
If I measure with Fibonacci I get important prices very close to what I expect.
😑 Ooops... The red levels... maybe I should correct my prices a bit hahahaha....
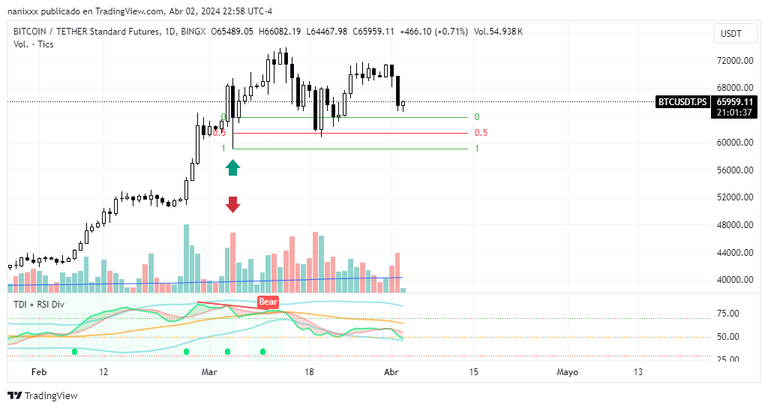
In short:
This I have just marked are possible moves and in my case I will only be watching for sharp changes in volume for my entries, although, as you can see, I already have points marked for them, and they are all buy.
We will see new highs but the correction is necessary and I repeat that a careful observation of these indicators (volume and TDI+RSI Div) can give clues about the market directionality.
Ask what you want to know in the comments and if you feel like it you can keep an eye on my trading that I share regularly on X.
😉
Original content by @nanixxx. All rights reserved ©, 2024.
Cover created in Canva. Image made by AI on ausbit's stuff and things discord channel.
Posted Using InLeo Alpha
FYI that invite link is expired, here is an invite that never expires to my main discord : https://discord.gg/ausbit-s-stuff-and-things-419390618209353730
And this link lets anyone invite arty directly to their own discord https://arty.ausbit.dev
Oh, thank you. I can edit it, of course.
Thank you for your support. 👌
🤔
Greetings and thank you very much for the effort. Best regards
😁 Remember the dotty hahaha
Abrazo.
. 🤔 😅
Abrazo
Vamos a ver si mi análisis al final de mes fue certero. Y si pude hacer mis operaciones, y cómo las hice. Esto es una actividad que me apasiona. Analizar gráficos.
Ya te veo con los gráficos, yo de criptos ni idea. Hice una buena operación cambiando COS por HIVE (sin querer), COS estaba muy alto (ahora está más) y el HIVE muy bajo. Los COS son las criptos de COS.TV. Cuando llegué cambié casi todo lo que tenía en la plataforma de videos acá y me salió bien. Por lo de más, las únicas criptos que tengo ahora son unos pocos COS y Hive, y el HIve parece que no se mueve con BITCOIN.
Hare´ un llamado al universo: El análisis es certero. LLoverán ganancias 💰
Ahí me quedo, creo que ha quedado escueto y preciso. ya nos contarás...
Jajaja... Gracias 🫂
Abrazo y hasta mañana
Do you think it will skyrocket during the upcoming halving?
Historically this has been the case. Although a smaller increase is now expected... But my friend, the chart for me is the one that speaks. Maybe by April 20th we won't see the 100K because I tell you, there is a correction that needs to be made, but after that maybe we will.
A bloody market is expected then before the real bull run?
Look at this monthly chart to see what happens after a rise.
I marked the candles with blue lines.
The market has to correct the rise. However, we have not broken strongly above the previous high of BTC. You have seen that it is a shy breakout and expectations and even some measurements on the charts say that the price could move above 100K.
I see a lot of volume and that is good. The upside may happen, but the market is not all one way all the time, and there are also the interests of the Institutions or whales that move the money. There will be fluctuations, and that is why some prices are marked and that is why some movements are predicted before the possible rise.