Why should I learn technical analysis?***
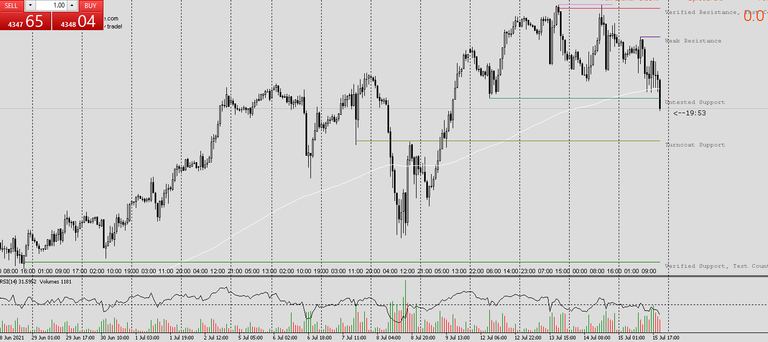
the graph is SP500 in my personal Pc
For those of us who come from other financial assets it is a routine analysis, but there are people who are working in cryptocurrencies unaware of the possibilities offered by being able to appreciate a graph correctly, since a correct decision can bring many more probabilities in our operations
Financial analysts can be classified as fundamental and technical.
Some claim to be better than others but the reality and experience is that neither can live without the other.
Financial graphs are traditionally used to represent the fluctuation of the price of said asset over time.
we can distinguish the following
Columns
Cone, cylinder and pyramid
Bars
Lines
Area
XY (Scatter)
Bubbles
Circular
Ring
Quotes
Surface
Radial
currently some have become obsolete but they are no less important for this reason,
In these paragraphs, we will only see commonly known candlestick charts or Japanese candles.
Japanese candles are a charting and analysis technique initially used in economics by the Japanese. They appear in Japan in the 18th century, in the rice market.
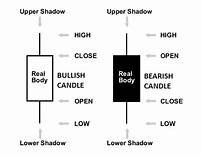
However, in the late 1990s it began to be used by North American wallstreet operators to represent financial graphs, beginning to understand their potential and all the information provided by each of the candles and their respective combinations ... there are manuals printed with information and prediction probabilities of the future price based on the formations they represent ......
Most used pattern candlestick
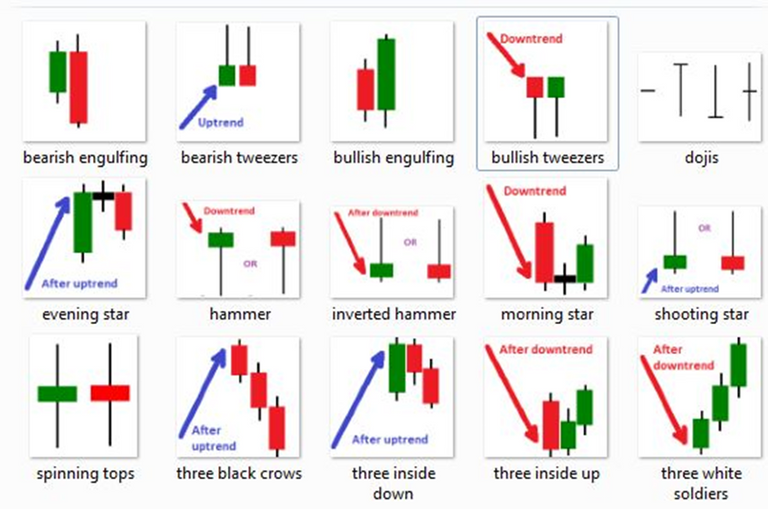 ![patronesdevelas.png]
It is useful to identify these candlestick patterns to make future decisions about the future value of the price of said asset.
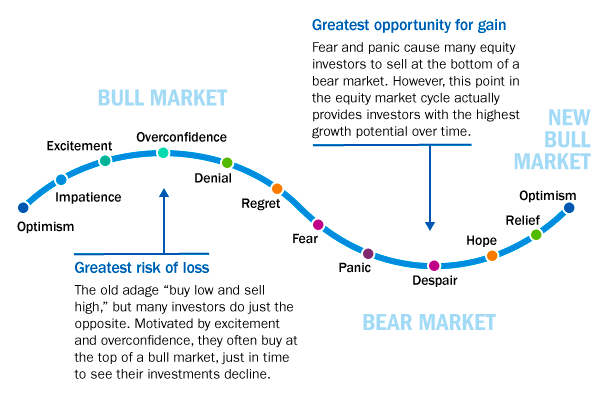
The patterns are used to determine with high probabilities a reversal of the asset or a continuation, since the price of an asset is neither more nor less than the representation of the sentiment of the masses about an asset, as described by DOWN in his first books.
Since that is why it is so difficult to determine the future price of an asset because it reflects the human feeling of greed, frustration, hubbub, etc.
This is part 1 in two or three days I will publish the second part of this introduction to technical analysis.
I hope you like it....
I also leave you my analysis of the BTC of the last 2 years !!!
![Screenshot 15_07_2021 , 02HIVE-167922
Posted Using LeoFinance Beta
Thank you, this information is very helpful
tnx for comment!!!!
Posted Using LeoFinance Beta
Congratulations @papa1816! You have completed the following achievement on the Hive blockchain and have been rewarded with new badge(s) :
Your next target is to reach 300 upvotes.
You can view your badges on your board and compare yourself to others in the Ranking
If you no longer want to receive notifications, reply to this comment with the word
STOP