The bear market has been hitting us all hard for more than half a year (so far in 2022), but some signs are beginning to appear that seem to indicate that a reversal is not that far away.
.
Image Source
Market Reversal
The long-awaited crypto market reversal must happen, and we are sure it will happen sometime between now and June-July 2023. By the time that happens, we will no longer be downtrend, but uptrend; and we will prepare to welcome it to the Bitcoin HardFork that will occur in 2024.
Of course, I am seeing everything starting from Bitcoin as a base, because as we all know, Bitcoin moves everything, because it is the most important and dominant cryptocurrency of all those that currently exist.
And, precisely, based on the technical analysis of Bitcoin, I have come to the conclusion that we are not that far from the market reversal, in fact, it may happen much sooner than expected; even from one moment to another.
Some signs of Reversal
From my point of view, we may be in the presence of a Bitcoin reversal that may be happening sooner than expected, in fact, if we look at the price of BTC, we realize that it is currently at $24,465, 68 ( at the time of writing this).
.
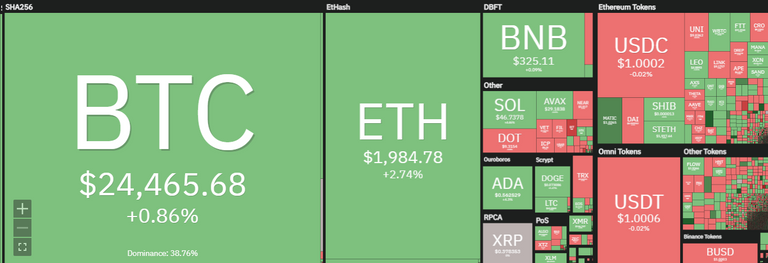
Image from Coin360.com
But what is relevant here is not the price itself, which is true that finally it seems to be rising somewhat, what is truly relevant is to see the behavior of the Bitcoin charts in different time frames through the use of technical analysis indicators; because only then will we realize what may be the prelude to the aforementioned reversal of the current trend of the Bitcoin market.
For example, let's take a look at the 1-hour timeframe of Bitcoin chart:
.
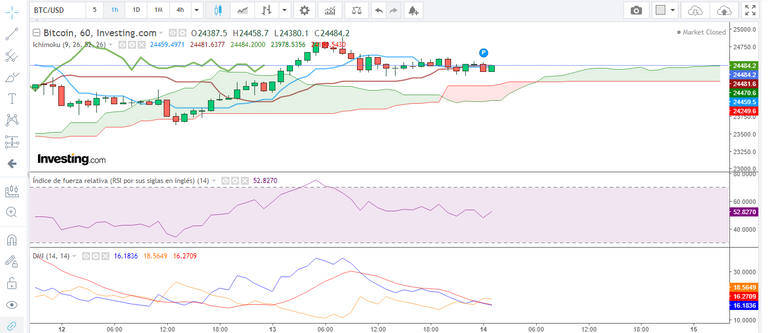
Image from investing.com
Using the Ichimoku indicator, the DMI and the RSI, we realize that Bitcoin is in an upward trend at this time; because the price is above the cloud, and because the Chikou Span line is confirming that, due it is also above the cloud.
The positive is, as I already said, it is already in an upward trend at this time, right now, but as a negative point, at the moment it does not have enough strength to continue increasing; and we can see that through the ADX line that is barely at point 16.27. Also, according to the DMI, there is no volatility in the market right now, although if there was, based on the thickness of the Ichimoku cloud that the price of Bitcoin is sitting on right now; It would easily cut it like butter from above down.
As a conclusion of the analysis of the Bitcoin graph in a 1-hour timeframe, we see that yes, it is in an upward trend, but it is not yet sustainable; however, what is happening is the kind of thing that we will see more and more frequently as the trend reverses, whenever it does.
Let's now take a look at the 4-hour time frame of the Bitcoin chart:
.
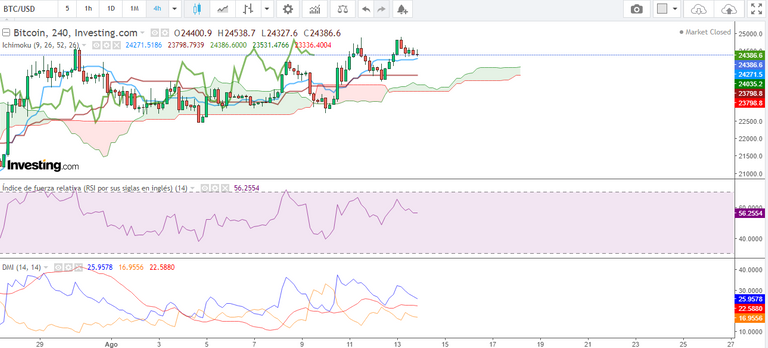
Image from investing.com
As we know, this is a longer timeframe than the previous one, and the projections are longer than those made in any lower timeframe. Limiting this, what we can see in the graph is even more encouraging than the previous one.
On the one hand, Ichimoku confirms again that the price of Bitcoin is currently in an upward trend, but now, in addition to showing us the price above the cloud, and the Chikou Span line above the cloud (the green line), it also shows us shows the Tenkan Sen line over the Kijun Sen line in a decisive way (blue line and brown line, respectively). As a negative point, the thickness of the cloud is still very thin, but the DMI indicator tells us that there is bullish volatility and strength, because the ADX it shows us at the 22.58 point.
Now let's look at the daily time frame of the Bitcoin chart.
.
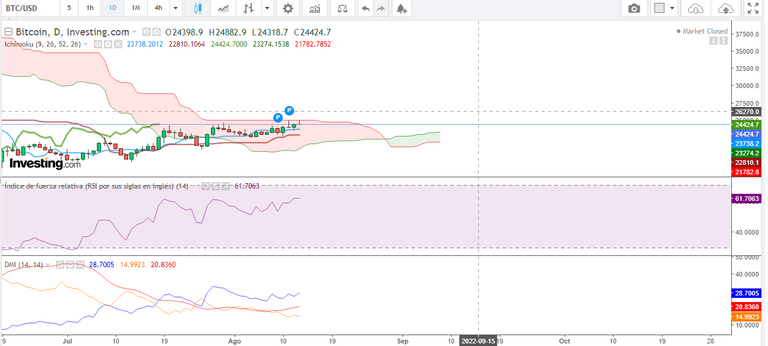
Image from investing.com
In this case, Ichimoku shows us that the price of Bitcoin is really in an area of uncertainty, technically, it is in what we could call a "Bobo Range"; but as a positive point, the trend just has to persist a little longer bullish in the minor timeframes, so that the price action and the Chikou Span line surpassed the cloud in this timeframe and thus see Bitcoin once and for all in an upward trend. It is as simple as that the price of Bitcoin and the Chikou Span line have to exceed $25,000 so that we can already be sure that we are in an uptrend in that sense.
According to the DMI indicator, as a negative point it shows us through the ADX (at the point 20.83) that there is not excessive strength, but on the positive side there is also no level that we can consider too weak; and another positive point is that DMI it is showing us positive volatility, which although it is not excessive, it is positive in the end.
Conclusion
So, what the charts are telling us is that although Bitcoin is not currently in an uptrend, because to be, it would have to show it on the daily chart, without a doubt it already is in less than daily timeframes.
But this is good, because they are signs of reversal, because it is well known that the smaller temporalities drag the larger ones, just as the smaller ones are influenced by the larger ones as well. Translation: By the time we have Bitcoin fully uptrend, we'll see all the charts showing us that; that is, at that moment we will see Bitcoin in an upward trend both on the daily chart, and on timeframes of 4 hours, 1 hour, and all other lower timeframes.
This is not to mention that we will very likely have the weekly and monthly timeframe in a pronounced upward trend by then as well.
So, we have every reason to remain hopeful of seeing the crypto market trending up again soon, and therefore we need to be on the lookout for opportunities to seize them, as traders and investors in the markets, appropriately.
What do you think about the topic discussed? Please comment.
.

Gif created by @piensocrates
Posted Using LeoFinance Beta
Congratulations @piensocrates! You have completed the following achievement on the Hive blockchain and have been rewarded with new badge(s):
Your next payout target is 500 HP.
The unit is Hive Power equivalent because post and comment rewards can be split into HP and HBD
You can view your badges on your board and compare yourself to others in the Ranking
If you no longer want to receive notifications, reply to this comment with the word
STOPTo support your work, I also upvoted your post!
Support the HiveBuzz project. Vote for our proposal!