[EN] Hello everyone. Bitcoin started an uptrend as I mentioned yesterday and paused this movement somewhere around $14100. Now he's struggling to continue, but according to the graph, things won't be easy. Actually, struggling was the wrong word. Let's call this a correction in analysis language. The price is tested once before going up. If the resistance cannot be broken, a retreat occurs and then retries. These withdrawal movements are often perceived as falling; but actually it should be defined as a minor correction and plans should be made accordingly. Anyway, let's see what has changed in the graphic after this correction.
BTCUSD DECISION PHASE IN THE HOURLY GRAPH
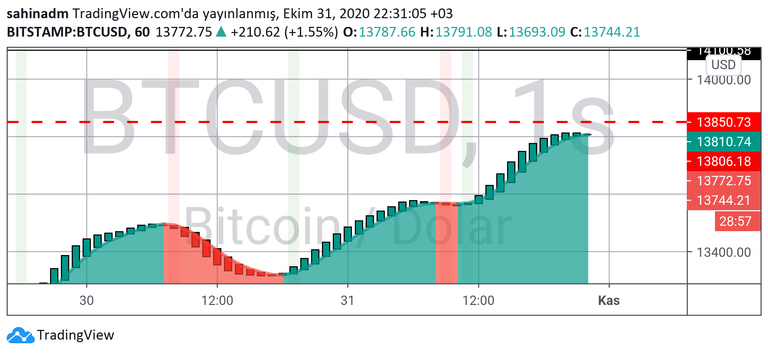
Don't be fooled that the chart is about to skew and give a SELL signal because the red candle has not yet come and it can continue up at any moment. It's always good to wait for the next candle to see the clear move (decision). That's why the hourly trend is now at the decision stage.
Above is the last tested price, $14100 level (resistance). Below is the support of $13420, which was strengthened by the last move. So the $13850 resistance is still not broken.
BTCUSD BUY SIGNAL IN 4-HOUR GRAPH
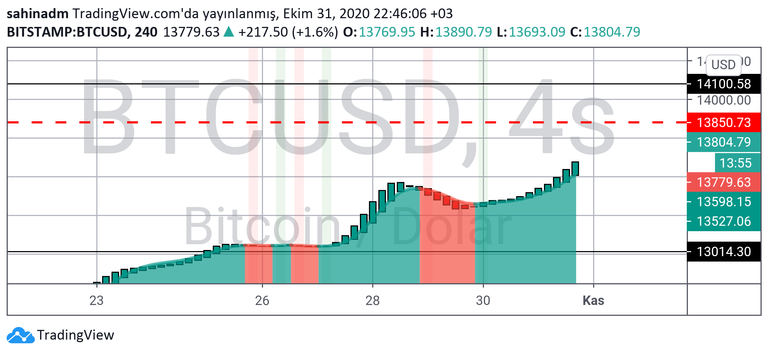
The candles keep moving forward. If the selling pressure on the hourly chart continues, this time a 4-hour trend change will come to the agenda and a correction will take place for this chart. This correction may now mean a decline rather than a correction for the hourly chart.
For now, the situation is fine. We protect our positive opinions. If it continues up, $14618 will be the more important level after the $14100 resistance. Below is support for $12892 for 4-hour corrections. Let's look at the daily chart.
BTCUSD BUY SIGNAL IN DAILY GRAPH
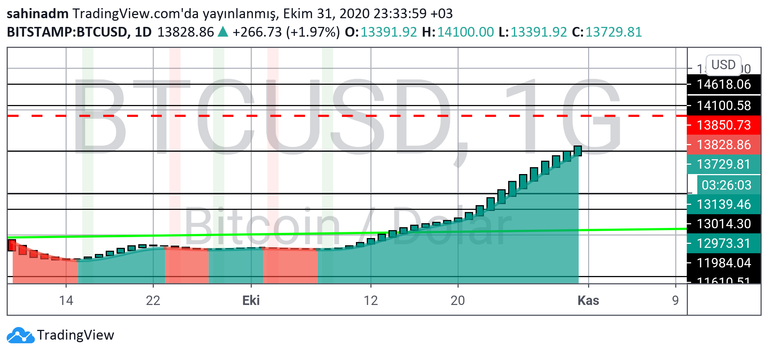
I remember saying that if there is a BUY signal on the daily chart, it is unafraid. Yes, it can not be feared because it looks like a giant. It is the daily chart that keeps the hourly and 4-hour averages alive. Since it is heavy and therefore slow, it actually prevents the sudden increase in prices. Because it ensures stable progress. This gives us the confidence we want. Isn't it better than rising fast and falling hard?
As can be seen in the chart, there is $13850 and $14100 as resistance, I don't think the $14100 resistance is very strong. They have more difficulties ahead; but after around $15000 difficulties begin.
The supports are listed as $13014, $11984, $11174. It will be useful to know what's below while watching the above.
Merhaba arkadaşlar. Bitcoin, dün belirttiğim gibi bir yükseliş hareketi başlattı ve bu harekete 14100$ civarında bir yerde ara verdi. Şu an de debeleniyor devam etmek için ama grafiğe göre işler kolay olmayacak gibi. Aslında debelenmek yanlış bir kelime oldu. Buna düzeltme diyelim analiz dilinde. Yukarı çıkmadan önce bir kere fiyat test edilir. Direnç kırılamayınca bir geri çekilme olur daha sonra tekrar denenir. Bu geri çekilme hareketleri çoğu zaman düşüş olarak algılanır; fakat aslında küçük bir düzeltme olarak tanımlanması ve ona göre planlar kurulması gerek. Neyse bu düzeltme sonrası grafikte neler değişmiş bir bakalım.
BTCUSD SAATLİK GRAFİKTE KARAR AŞAMASI
Grafiğin iyice yamulup SAT sinyali vermek üzere olduğuna aldanmamak gerek çünkü daha kırmızı mum gelmedi ve her an yukarı devam edebilir. Net hareketi (kararı) görmek için her zaman bir sonraki mumu beklemekte fayda var. Bu yüzden saatlik trend şu an karar aşamasında.
Yukarıda son test ettiği fiyat, 14100$ seviyesi (direnci) var. Aşağıda ise son hareketle güç kazanan 13420$ desteği var. Yani 13850$ direnci halen kırılmadı.
BTCUSD 4 SAATLİK GRAFİKTE AL SİNYALİ
Mumlar ilerlemeye devam ediyor. Saatlik grafikteki satış baskısı devam ederse bu kez 4 saatlik trend değişimi gündeme gelir ve bir düzeltme de bu grafik için gerçekleşir. Bu düzeltme artık saatlik grafik için düzeltmeden ziyade düşüş anlamına gelebilir.
Şimdilik durum gayet iyi. Olumlu fikirlerimizi koruyoruz. Yukarı devam etmesi halinde 14100$ direncinden sonra 14618$ daha önemli bir seviye olarak karşımıza çıkacak. Aşağıda ise 4 saatlik düzeltmeler için 12892$ desteği mevcut. Şimdi günlük grafiğe bakalım.
BTCUSD GÜNLÜK GRAFİKTE AL SİNYALİ
Günlük grafikte AL sinyali varsa korkulmaz dediğimi hatırlıyorum. Evet korkulmaz çünkü dev gibi duruyor. Saatlik ve 4 saatlik ortalamaları ayakta tutan grafik, günlük grafiktir. Ağır ve dolayısıyla yavaş olduğu için aslında fiyatların ani yükselmesine bir yerde engel de oluyor. Çünkü istikrarlı ilerlemeyi sağlıyor. Bu da istediğimiz güveni veriyor bize. Hızlı yükselip sert düşmekten daha iyi değil mi?
Grafikte de görüldüğü gibi direnç olarak 13850$ ve $14100 var ki $14100 direncinin çok güçlü olduğunu düşünmüyorum. İleride daha güçlükleri var; fakat 15000$ civarından sonra zorluklar başlıyor.
Destekler ise 13014$, 11984$, 11174$ şeklinde sıralanıyor. Yukarıları izlerken aşağıda neler var bilmek faydalı olacaktır.
Dilerseniz yazıyı buradan da görüntüleyebilirsiniz. Kolay gelsin.

Analizlerim hiçbir şekilde yatırım tavsiyesi değildir, genel durumu belirlemek içindir. Bu analizler al/sat yapmaya uygun değildir. Bu analizlere dayanarak yapılan alım veya satımlardan doğacak zararlardan yatırımcı sorumludur.
Grafikler, www.tradingview.com grafik veri sunucusunda @sahinadm tarafından oluşturulmuştur.