The daily chart on bitcoin doesn't look great. Last week's sell off has subsided, but we are now seeing a consolidation that forms a bear flag pattern.
This pattern has bear in the name for a reason. However, this doesn't guarantee we are going lower immediately. Let's take a look at the chart below to see what I am talking about.
Lions and Tigers and MORE BEARS, Oh My!
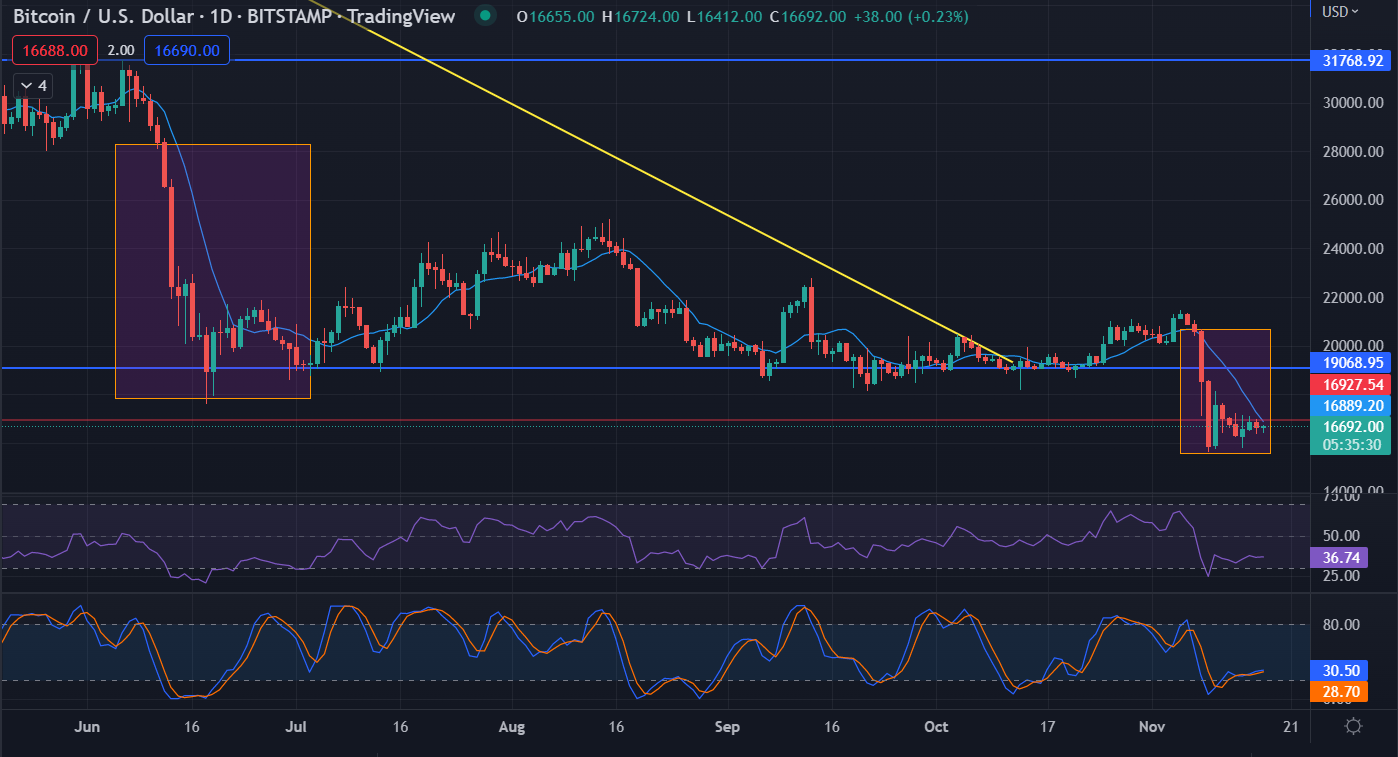
On the chart you will see to areas highlighted by purples boxes.
One is our current price action and the bear flag that is forming. For those not familiar with this patter it is when you see a hard decline over a few days, which makes the chart look as if there is a pole and then it is followed by several days of consolidating price action that looks like a pennant.
Thus, it all looks like a flag forming on the chart. When it happens to be a bearish flag you essentially have an upside down flag on the chart.
Now, the same thing happened back in June of this year. Hard sell off followed by tightening consolidation and then....well a whole lot of nothing.
There was no break lower or even much of a move higher. We just watched price go sideways for 4 months before something finally happened.
It was a big something too, with the FTX collapse being the catalyst to a sell off that finally took price lower.
So I guess the question is - has that catalyst run its course? Will there be another in the very near future? Or will we grind sideways again?
Posted Using LeoFinance Beta
Let's just nuke to $12k and move on. I wouldn't mind that at all.
I hear that!
Posted Using LeoFinance Beta