It has been much too long since I did a review of the leo token price action.
Can you believe that it has been a year since this price data has been available? I remember having to do analysis on the 4 hour chart because there wasn't enough data yet.
It has been an interesting ride over the past 12 months that settled into quite boring price action for the second half of that.
LEO Token Range Bound
Atleast it is consistent....
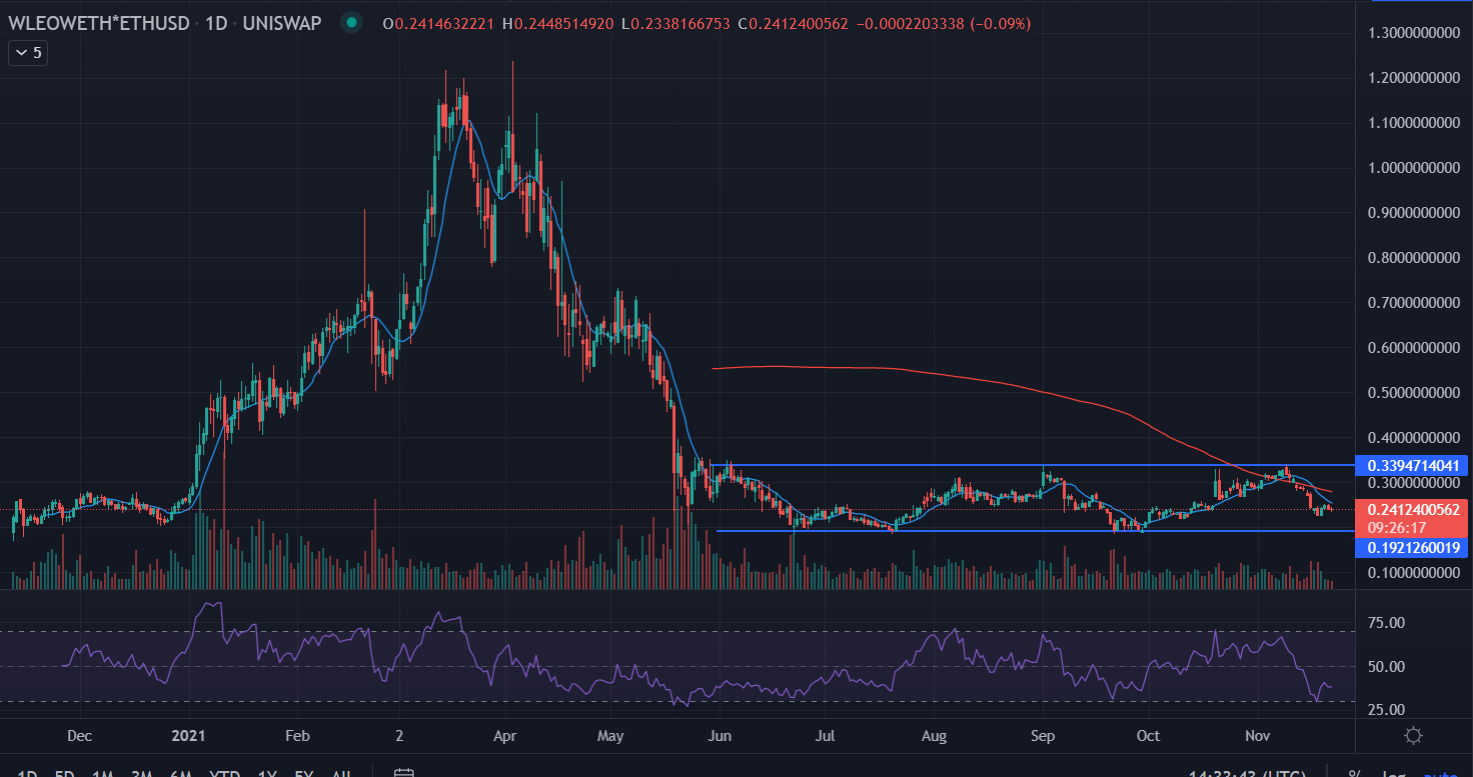
When looking at the daily chart above you can see price has been stuck in a 15 cent range since May of this year.
With 34 cents being the upside resistance and 19 cents being the downside support.
Honestly, until price breaks one of these marks there isn't too much to talk about.
I supposed one could trade the range, but then you would need to keep a good chunk of LEO liquid and miss out on curation rewards and the like.
With all the projects in the funnel for leofinance maybe the token will get that catalyst to push through to the upside.
Posted Using LeoFinance Beta
Probably better off keeping it in the bleo-BNB pool rather than trading, best place for it!
Agreed
Posted Using LeoFinance Beta
It's felt boring, but seeing it like that confirms it. haha.
Posted Using LeoFinance Beta
Do u think project blank could be the catalyst?
Posted Using LeoFinance Beta
Succinct. I can't really argue with that realistic and speculation-free analysis!
It sure looks like HIVE before starting its massive uptrend from $0.13 to $1.
Posted Using LeoFinance Beta
I sure hope you are right!
Posted Using LeoFinance Beta
Looks like accumulation.
Posted Using LeoFinance Beta
May I ask where can you look at this long period of data? Leodex and hive-engine only covers a few month.
I use tradingview. It has WLEO on there.
Posted Using LeoFinance Beta
The price of leo is going down. We are expecting it to get a strong support that will help it to continue uptrend
Posted Using LeoFinance Beta