Occasionally I like to check on the stock market even with crypto being my main focus these days.
Looking at a larger timeframe always helps decipher the forest from the trees, as the saying goes.
Descending Channel
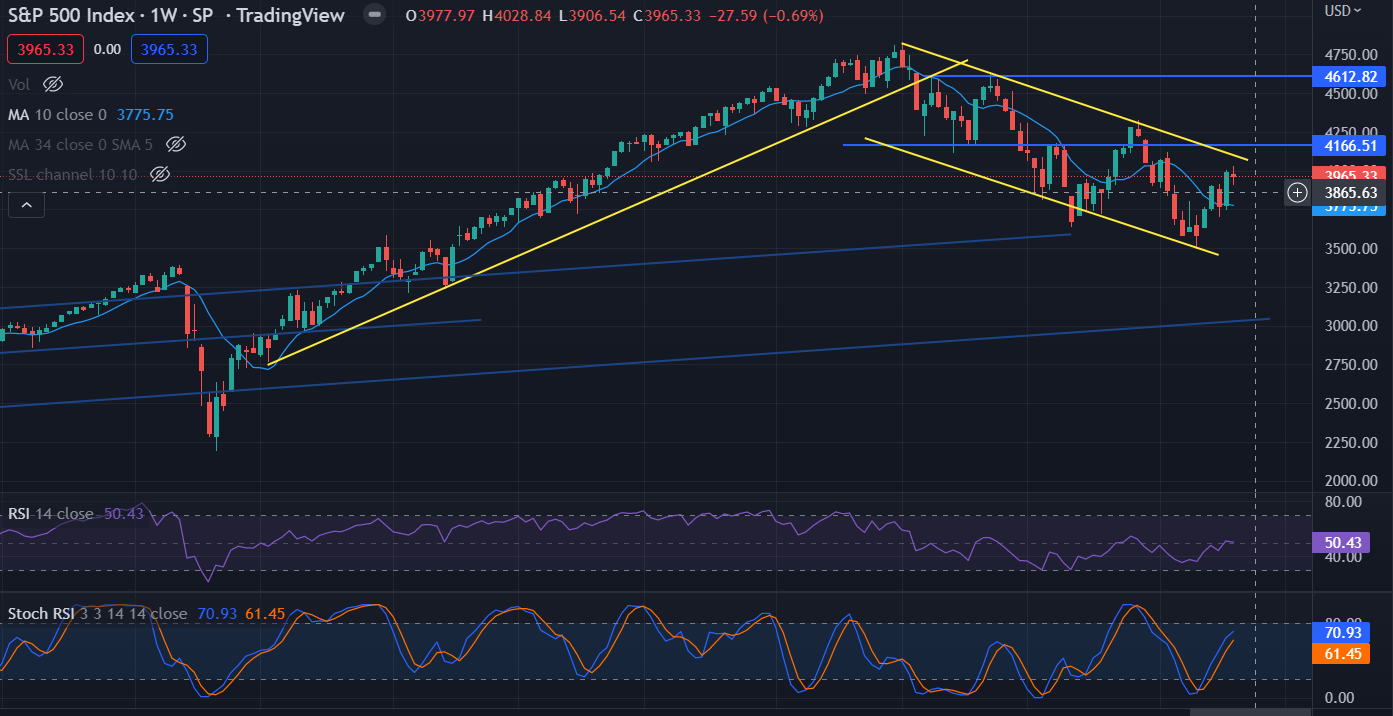
Looking at the chart above you can see from the yellow uptrend line that the market was in a clear bullish channel from the covid low until January of this year.
It was quite the run.
That run is now over and the rest of 2022 has proven to be a bunch of lower highs and a pretty clear descending channel formed.
Markets have bounced of late off the lows, but clear still in this channel. If price pushes higher to break that upper line on the channel than maybe the bearish tone ends. That remains to be scene though.
Assuming this channel trend continues we should expect a turn lower in the market over the coming weeks as price heads back down to the low end of the range.
As always, the impact on crypto prices is something I pay mind too. Though the correlation isn't 100% it is still there.
Posted Using LeoFinance Beta
What is often stated is that crypto being more liquid, it is often sold to shore up margin calls. The cumulative effect is to drive down crypto prices. I don't know how true that is.
Posted Using LeoFinance Beta
I think it holds some weight. Margin calls on equities leads to sales of speculative crypto to fund those.
Posted Using LeoFinance Beta
If it wasn't for FTX Bitcoin would have bee way higher.