The analysis of bitcoin's technical characteristics indicates the beginning of a consolidation period after the price drop. With a daily trading volume of $45.30 billion and a total market capitalization of $1.29 trillion, the cryptocurrency market maintains high liquidity and wide reach.
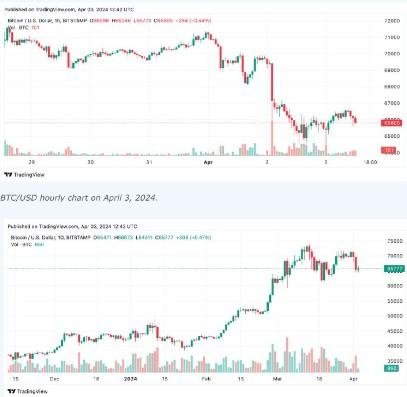
However, the recent declines have caused concern among traders. Bitcoin's price has fallen 6% this week. The hourly chart shows a stable downtrend, indicating a potential negative outlook in the near future.
Moderate market volatility over the period suggests some resistance to further significant selling, but the support level at $64,511 and resistance at $69,464 define a limited trading range.
On the four-hour chart, bearish sentiment persists, confirmed by increased volatility and significant price swings. Nevertheless, the support level at $64,511 and a new resistance point at $71,391 indicate a wider range of possible price movement.
Medium-term analysis also shows that the market is in search of direction, with oscillators, most of which are in neutral territory, with some bias towards sell signals.
The daily chart shows a complex pattern of alternating bullish and bearish trends, pointing to a broader consolidation period. Significant volatility emphasizes the uncertainty in the market. However, the latest significant drop indicates a bearish trend.
Support at $59,313 and resistance at $73,794 define the boundaries of this long-term phase, indicating critical levels that could determine bitcoin's future path.
The combined analysis of oscillators and moving averages indicate wariness and uncertainty in the market. The Relative Strength Index (RSI), stochastic and other oscillators mostly indicate neutrality, although bearish indicators among moving averages, especially on short- and medium-term charts, point to underlying negative pressure.
Despite recent bearish signals, longer-term indicators are revealing major strengths that could set the stage for a bullish reversal. The emergence of buy signals on the long-term moving averages, especially starting from the 50-day moving average, indicates potential fundamental support and upward momentum.
Thus, bitcoin's short- to medium-term trend is bearish, while the long-term trend is leaning bullish.
Posted Using InLeo Alpha
Congratulations @serfis3! You have completed the following achievement on the Hive blockchain And have been rewarded with New badge(s)
Your next target is to reach 200 upvotes.
You can view your badges on your board and compare yourself to others in the Ranking
If you no longer want to receive notifications, reply to this comment with the word
STOPCheck out our last posts: