Hello hivers,
Today we will look into some key levels of etherium crypto currency.
Monthly Time Frame
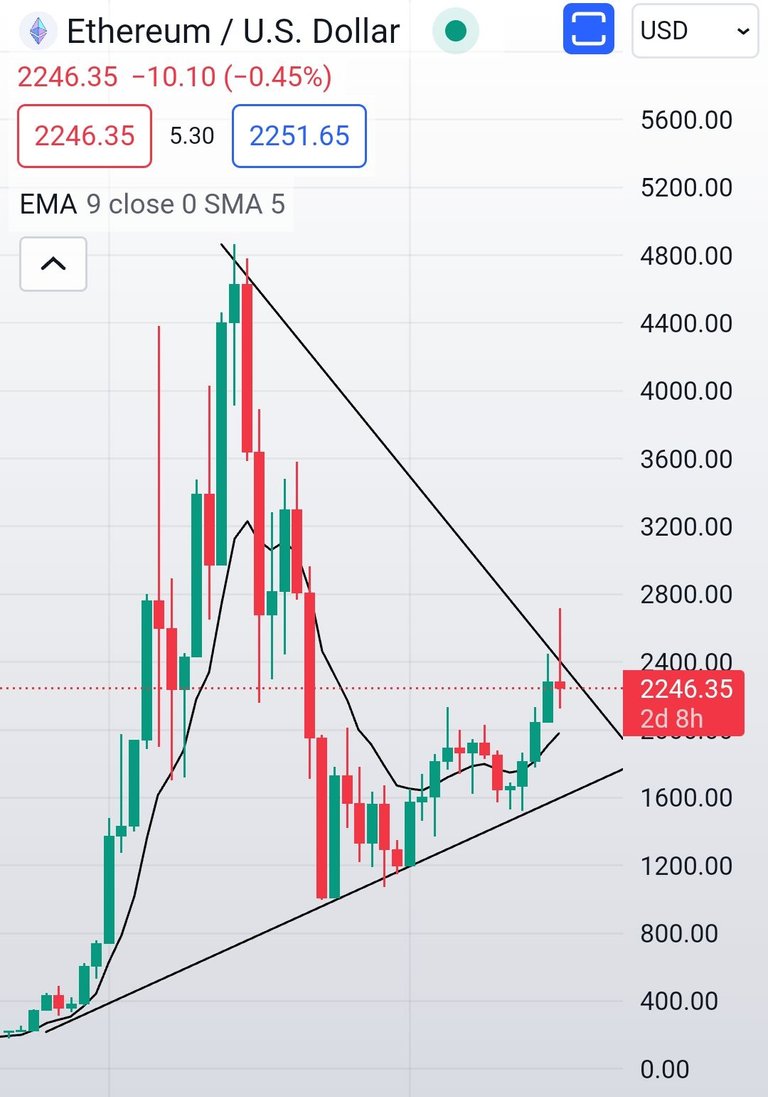
In the monthly timeframe, Ethereum (ETH) is exhibiting a triangular pattern, which suggests a period of consolidation and indecision among market participants. This formation typically resolves with a significant price movement.
Weekly Time Frame
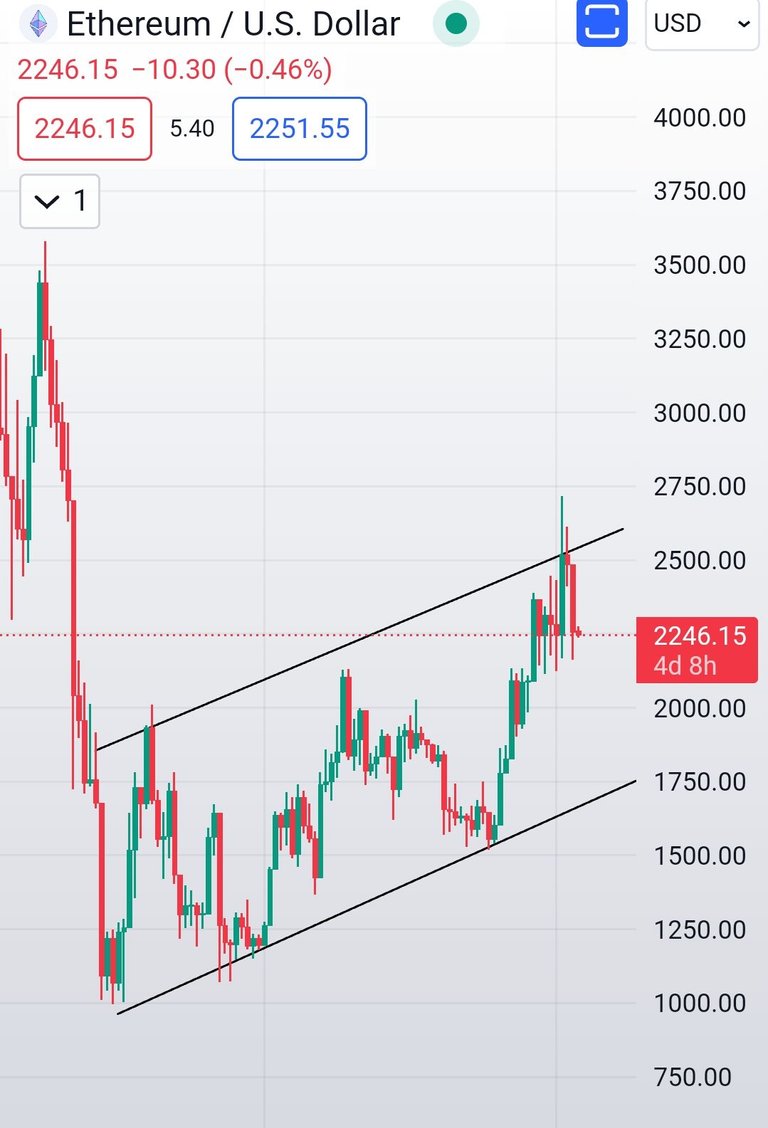
On the weekly chart, there is a bearish flag pattern, signaling potential downward pressure. The flag pattern often indicates a continuation of a prior downtrend. Traders and investors should be cautious as this pattern suggests the possibility of a market decline.
Daily Time Frame
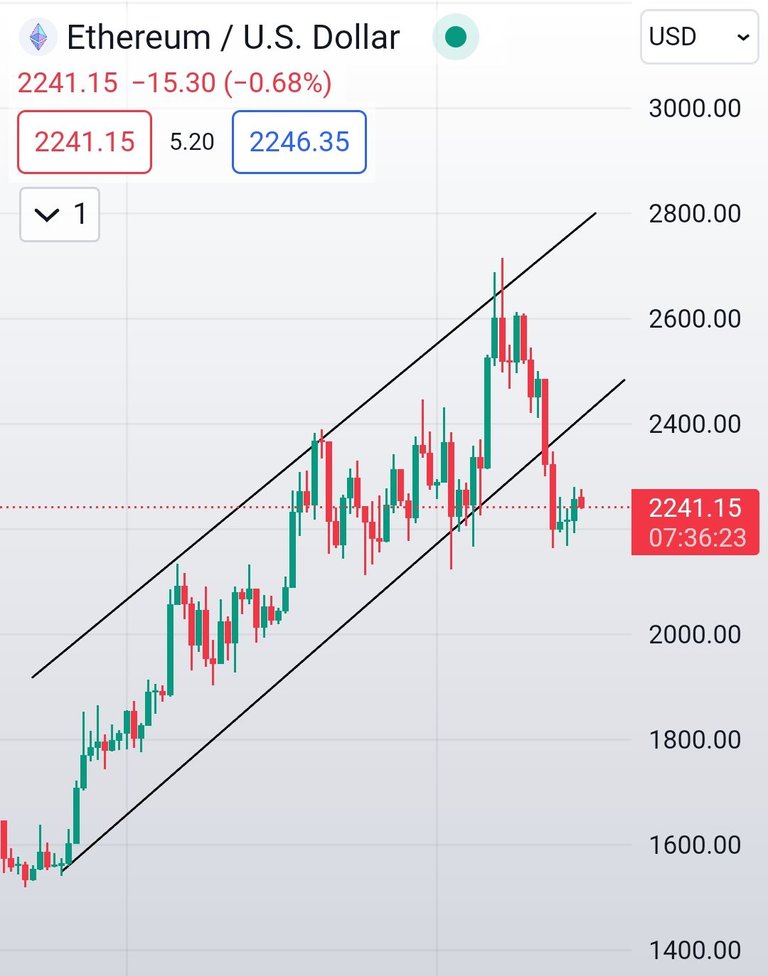
However, in the daily timeframe, Ethereum is forming higher highs and higher lows, indicative of an upward trend. This conflicting signal may indicate short-term bullish momentum, despite the bearish patterns on longer timeframes.
Remember, technical analysis is a guide, not a crystal ball. It provides us with clues and signals, but the market is an unpredictable dance partner. Keep a keen eye on these patterns, and don't forget to factor in the broader market sentiment.
Thank you...