Hello friends,
As at the time of writing, $GRT is currently trading at 0.4295 support level and at 85.53% below its ATH. The last price action period was 15th October to 20th November with the bears gaining momentum and pushing the price further downward creating local lows. apparently, this protocol is very close to touching its ATL at the Fib level of 1.
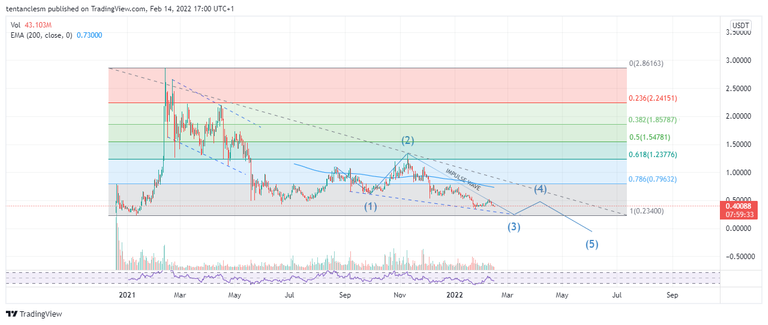
https://www.tradingview.com/x/VE0CbsvQ/
However, a possible Elliot's Wave pattern formation is in play with the first, second and 3rd wave almost completed if price should fall below the support its currently trading. If that happens, then support becomes resistance and we are to see price form another local high signalling the end of Wave 4 before falling below current Fib.
The direction below the 200EMA only encourages short trades and DCA to bag more....(I think).
Trade carefully as this might not be a Financial Advise due to the volatility of the crypto space.
Thank you for reading, please your comments below as i would love love to hear your views this is mine.
Posted Using LeoFinance Beta